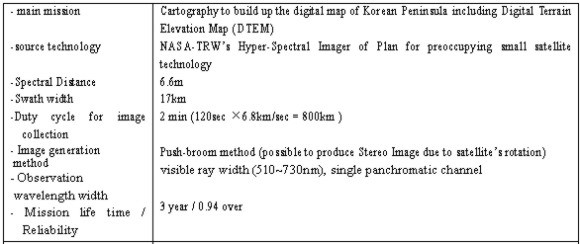
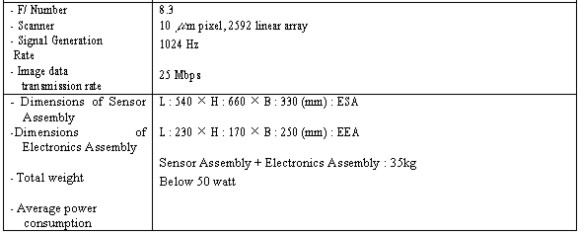
IMPROVEMENT OF GEOMETRIC CORRECTION ACCURACY ACCORDING TO GCP DISPOSITION OF KOMPSATJongchool LEE, Sungyeol CHA and Dongju SEO, KoreaKey words: Ground Control Point(GCP), Geometric correction, Resampling, EOC, GCP Disposition. AbstractThere are invisible wars going on to preoccupy required satellite information for national defense, industry and living in the out space. Therefore, Korea developed and successfully launched KOMPSAT (Korea Multi-Purpose Satellite), Korea's first multi-purpose applications satellite, on December 21, 1999. In the course of geometric corrections with KOMPSAT images, accuracy of GCP collections are analyzed the coordinated of digital map respectively. Accuracy according to the GCP disposition was also analyzed. For disposition of GCP, it turned out that even distribution on the whole screen contributes to promote accuracy. These are expected to be used as basic data in putting the KOMPSAT geometric correction into practical use. 1. INTRODUCTIONNowadays, every country has been competitively at the invisible war in the space in order to get the information necessary for national defense, industry and living. Korea also has opened the Satellite Age since the satellites such as the scientific research satellite, "KITSAT-1(Korea Institute of Technology Satellite-1), and KITSAT-2" and the broadcasting & communication satellite, "KORSAT-1 and KORSAT-2" were launched. And Korea developed the first Korea Multi-Purpose Satellite, "KOMPSAT" and launched it on December 21, 1999 and successfully received the practical information from the satellite. KOMPSAT is the remote sensing satellite for the earth like Landsat or SPOT, and since it is equipped with EOC(Electro-Optic Camera), which has the resolution with the ground sample distance(GSD) of 6.6m, and two ground photographing LRCs(Low Resolution Camera), which has the resolution with 1km GSD, it can observe Korean Peninsula real-time and epochally contribute to the cartography, prevention of calamities, management of national land and development of vegetation and forest field. This study analyzed the accuracy according to GCP(Ground Control Point) Disposition by using KOMPSAT's EOC images, and it has the study goal that this can be used as the basic data for improving the geometric correction accuracy with KOMPSAT. 2. KOMPSAT2.1. Necessity of KOMPSATIt is considered that the necessity for developing Multi-Purpose Satellite has a very important meaning in aspects of industry and technology nationally. First, as the national necessity for developing it, there are the aspects of securing the space in the earth orbit and extraterrestrial territory, and reinforcing aerospace technology competitiveness such as exploring the national land resources, forecasting weather, communication, broadcasting and science, and the national security for military strategy by using satellites, and second, as the technological and industrial necessity for developing it, since it is the high value-added industry combined with high-tech and it can accomplish the advanced structure of industry, and it contributes to satisfy the domestic demand for satellites by securing the ability to manufacture satellites in domestic, and it takes a role of bridgehead in advancing into foreign aerospace markets, And third, as the social and cultural necessity for developing it, there are the use of satellites for securing digitalized society's mass media such as satellite mobile communication and video conference, culture zone and the extension of independent cultural territory. 2.2. KOMPSAT's equipments on boardKOMPSAT's system configuration includes the spacecraft combined with sensors and satellite main body, launch vehicle and ground station. The sensors among them are loaded with Electro-Optical Camera (EOC), Ocean Scanning Multi spectral Imager(OSMI), and Space Physics Sensor (SPS). 2.2.1. Electro-Optical Camera (EOC) The main mission of EOC is a remote photographing Korean Peninsula and then to make Digital Elevation Model of the national land and produce a stereo map. The stereo map is digitalized and used as data for making an electronic map, and it becomes the basis of GIS and can be used for national land management and preventing disasters. EOC collects panchromatic ground images at the wavelength range of 510 ~ 730 nm, and the ground station mixes and treat the images of various orbits and gets the stereo images. The resolution for ground is 6.6m, and the swath width at Nadir view is 17km, and 800km image per orbit is possible continuously to photograph, and EOC's specifications is as shown in <Table 2.1>. Table 2.1 Specifications of EOC(Electro-Optical Camera)
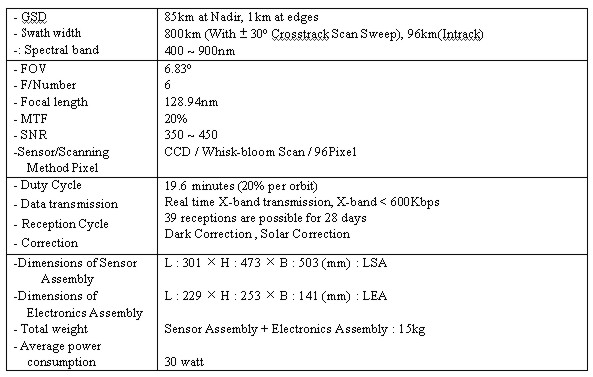
2.2.2. Ocean Scanning Multispectral Imager (OSMI) For the purpose of observing marine resources & environment all over the world, OSMI (Ocean Scanning Multispectral Imager) draws Biological Oceanography based on the observed data of seawater color. OSMI has the ground swath of 800 km and ground sample distance (GSD) of 1km, and it collects ocean color data in 6 spectral bands by whisky-broom scanning method at the altitude of 685km, and performs the function to transform this into electronic signals and transmit them to the ground station through PDTS. And OSMI's specifications are as shown in <Table 2.2>. Table 2.2 Specifications of OSMI (Ocean Scanning Multispectral Imager)
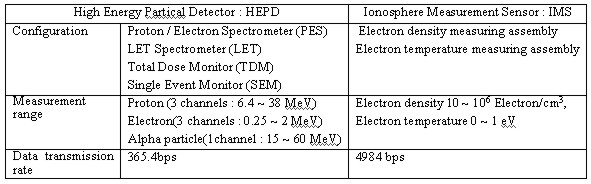
2.2.3 Space Physics Sensor (SPS) Space Physics Sensor (SPS) consists of two scientific instruments, High Energy Particle Detector (HEPD) and Ionosphere Measurement Sensor (IMS). HEPD performs to measure the low altitude high energy particle and can study the effects on the micro electronics due to these high energy particles, and IMS is used for the whole earth characteristics search of ionosphere in Arirang Satellite's orbit through measuring electron density and electron temperature of the earth ionosphere. The capability and specifications of SPS are as shown in <Table 2.3>. Table 2.3 Capability & Specifications of SPS (Space Physics Sensor)
3. GEOMETRIC CORRECTION3.1. Basic concept of geometric correctionThe image data acquired by remote sensing includes the considerable distortion portion made by the earth's curved surface. In order to overlap this distorted image with the existing topographical map, which exists on the plane, we should go through the process to transform the satellite's image into the same size and projection value as the topographical map. We call this transformation process geometric correction, and only after going through this process, we can get the stable images as the form that we can generally see through maps. Generally, the methods of geometric correction can be divided into two, System correction and GCP (Ground Control Point) correction. The system correction is the method that after analyzing all the causes of geometric errors that we have observed on the above, we find the reversed transformation system, which transforms the distorted image into the original one, and then we make correction on distortion. On the other hand, the GCP correction is the method that without considering the cause of distortion, it analyzes just the distortion degree and find the correction formula, which can connect the collected images with the digitalized map, and then corrects the image distortion. That is, when we suppose GCP's coordinate on the map is (xn,yn) and the image coordinate is (un,vn), the goal is to find the related formula between them by connecting two coordinates, and generally it does not use over cubic. The correction formula using GCP and the transformation formula between these coordinates are as shown is Formula (3.1).
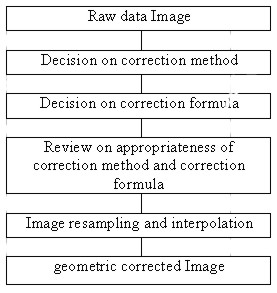
In this case, we should find total 6 unknowns in order to determine the transformation formula of Formula (3.1), and accordingly we should select the exact GCPs at least not less than 6. Above all, the most important thing in selecting GCP is whether that point is rational as a reference point. Since GCP become a reference point in transforming between image coordinate and map coordinate, their positions should have no change always. As a point for this, crossroad has the highest reliability, and in addition, edge of bank or top of mountain is used much. And, since the basic concept of GCP correction is that it artificially adjusts the reference points to the corresponding positions on the map and it determines the positions of the points between them by interpolation, if GCPs are not distributed evenly throughout the area, we may have possibility that the distortion can appear more largely rather than before the transformation in the area where it has no GCP or few. 3.2. Procedure of geometric correctionThe general procedure of geometric correction is as shown in the following <Fig. 3.1>.
Fig. 3.1 The general procedure of geometric correction 3.2.1. Decision on correction method and correction formula Correction method and correction formula should be decided by judging the characteristics of geometric distortion and the data available for correction or the distribution chart of reference point data. And about 3 correction methods are generalized and the correction formula corresponding to them are expressed also. First, the systematic correction is often used for focal distance, position and posture on sensor structure, and correction formula uses collinearity equation, Second, non-systematic correction is used only when we use the corresponding relation between image coordinate and map coordinate at reference points for the coordinate transformation formula between image coordinate system and map coordinate system, and the linear, quadratic isogonal transformation formulas and the higher polynomial are used as correction formulas as shown in formula (3.2) and formula (3.3). Third, combined correction is the correction formula that determines by using theoretical correction formula and reference point. Linear isogonal transformation formula is
Quadratic isogonal transformation formula is
3.2.2. Review on appropriateness of correction method and correction formula Review on appropriateness of correction method and correction formula is a very difficult part. We have no clear standard about the number of GCP and the range of RMSE value of position accuracy. The correlation formula between the number of GCP and the grade of polynomial necessary for the image size that we acquired in this study is expressed in the formula (3.4).
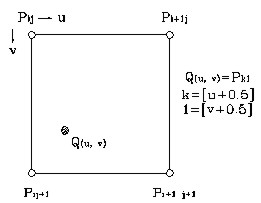
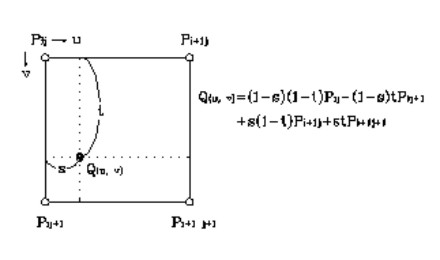
In using RMSE (Root Mean Square Error) that expresses the position accuracy, it defines the range of allowable error by scale in "Digitalized Mapping Bylaws, Section 10(Accuracy)", and it is expressed as the standard deviation of plane position by 1/25,000 is 5.0m and the maximum deviation is 10.0m. Accordingly, since SPOT, IRS and Multi-purpose Satellite(Arirang1) has the GSD (ground sampling distance) that can draw digitalized maps on a scale of 1/25,000, the allowable error is set by 0.5~2 Pixel. 3.2.3. Image resampling and interpolation If the coordinate transformation formula for geometric correction is decided, the new image data can be output after the data is transformed by the formula. At this time the newly decided coordinate is expressed as not integer but real number, and in this case the method is called as "Resampling" that we decide the pixel value that the new coordinate will have by supposing the continuity that each pixel value makes. This resampling method has three cases according to interpolation method. First, there is Nearest Neighbor (NN) method that it takes the nearest pixel value to a new pixel position as a new pixel value, and second, there is Bi-Linear (BL) method that it calculates the pixel value by using 4 pixel values surrounding a new pixel, And third, there is Cubic Convolution (CC) method that it interpolates, based on the assumption that 16 pixels around a pixel form the surface consisting of cubic polynomial, and they are correlated with one another. Therefore, the first method is usually used in case of analyzing the object image's contrast feature or image classification, and the second & third methods are used in case of the data that we can fully anticipate the pixel value's continuity in the partial areas such as data for visual analysis, altitude data or temperature data. Each interpolation method for this image resampling is expressed in <Fig. 3.1>.
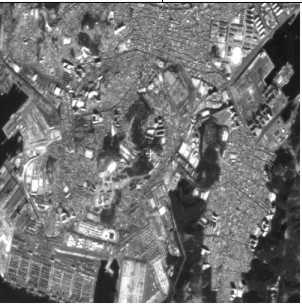
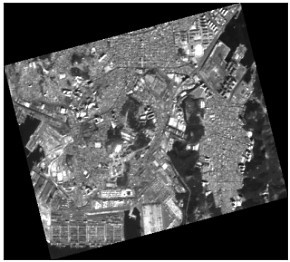
Fig. 3.1 Interpolation method for this image resampling 4. EXPERIMENT & ANALYSIS4.1. Experimental methodThe object area of experiment in this study is the vicinity of Nam-Ku, Pusan, Korea, and we used the high resolution camera image provided by Multi-purpose Satellite(Arirang-1), and the specifications are as shown in <Table 4.1>, and <Fig. 4.1> shows a raw image by KOMPSTAT. Table 4.1 The specifications of Image
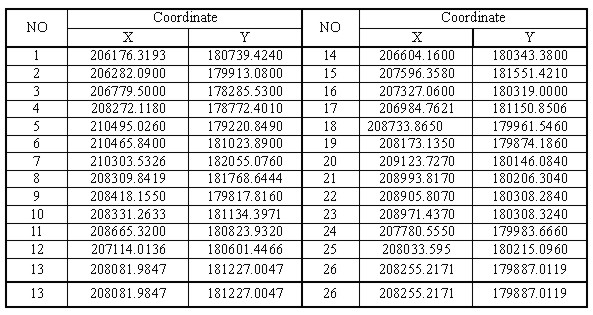
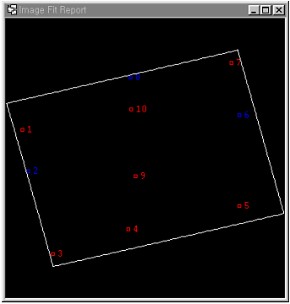
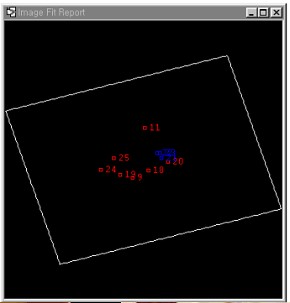
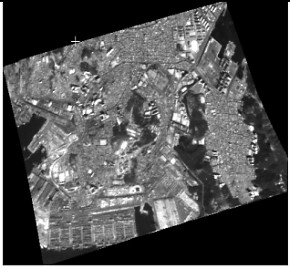
Fig. 4.1 shows a raw image by KOMPSTAT And in this study, we selected a subset of raw image and experimented it with 500x500 pixel image, and we acquired the coordinate for reference point by using Digital Map (1:1,000) and the coordinate is shown in <Table 4.2>, and we made geometric correction with 10 GCPs, and we set 3 Check Points and examined them. We disposed GCPs by 3 types, and the disposition is shown in <Fig. 4.2>, and as shown in the figure, Type 1 evenly disposed GCPs, and Type 2 disposed GCPs densely concentrated in the center of image, and Type 3 divided image into 4 sectors and disposed GCPs in one sector. Table 4.2 using Digital Map and the coordinate is shown in <Table 4.2>
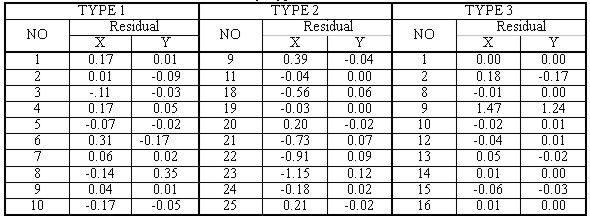
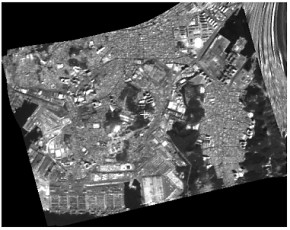
Fig 4.2 The disposition for each GCP by Type is shown The error for each GCP by Type is shown in <Table 4.3>, and here the Check Points for Type 1 is No. 2, 6, 8 and the Check Ponts for Type 2 is No. 21, 22, 23 and the Check Points for Type 3 is No. 2, 9, 15. And if we find each RMSE by Type, we could find that RMSE in Type 1 was X=0.29(pixel) Y= 0.08(pixel), RMSE in Type 2 was X=0.77(pixel) Y= 0.08(pixel) and RMSE in Type 3 was X=0.06(pixel) Y= 0.02(pixel), and it satisfied the range of allowable error by scale of digitalized mapping that is set in "Digitalized Mapping Bylaws". The image geometrically corrected by using the most popularized method, Nearest Neighbor (NN) among the resamplings, which is the next step after geometric correction, is as shown in <Fig. 4.3>. Table 4.3 The error for each GCP by Type
Fig 4.3 Shown of image after geometric correction 5. CONCLUSIONAs a result we studied by disposing GCPs by 3 Types for the purpose of improving geometric correction accuracy according to the disposition of GCPs of Multi-purpose Satellite in this study, we could get the following conclusions.
REFERENCES
CONTACTProf. Jongchool Lee A Prof. Sungyeol Cha Dongju Seo 13 April 2001 This page is maintained by the FIG Office. Last revised on 15-03-16. |
||||||||||||||||||||||||||||