Thematic Mapping for Disaster Risk Assessment in Case of Earthquake
Silvia MARINOVA, Temenoujka
BANDROVA, Mihaela KOUTEVA-GUENTCHEVA, Stefan BONCHEV, Bulgaria


Silvia Marinova, Temenoujka Bandrova,
Mihaela Kouteva-Guentcheva, Stefan Bonchev
1)
In this paper was presented at the FIG Working Week, 17-21 May 2015 in
Sofia, Bulgaria. The paper presents a conceptual model for information
system for expert express evaluation of the earthquake risk over the
Bulgarian territory using GIS. Several damaging earthquakes have shaken
the Bulgarian territory since 1818. To reduce the damages it is
necessary to have at disposal preliminary estimates of frequency and
magnitude of the earthquakes, particular engineering characteristics of
the seismic action and relevant opportunities for disaster management.
SUMMARY
According to recent decades statistics the earthquakes cause major
damages and casualties among all natural disasters, followed by floods
and tropical cyclones. The annual risk for victims of earthquakes all
over the World is estimated at 10 000 - 15 000 people per year. Several
damaging earthquakes that shake Bulgarian territory (1818, 1858, 1904,
1928, 1977, 1986, 2012) led to significant damage. About 360 victims due
to earthquakes are reported in Bulgaria since 1901 until now. To reduce
human losses and damages it is necessary to have at disposal preliminary
estimates of frequency and magnitude of the earthquakes, particular
engineering characteristics of the seismic action and relevant
opportunities for disaster management.
Earthquake risk estimation and management encompasses large quantity of
heterogeneous information data sets, including different types of maps,
statistical information and expert knowledge. This paper represents some
of the efforts, performed within the framework of the university
UACEG-CNIP research project dealing with a conceptual model for
information system for expert express evaluation of the earthquake risk
over the Bulgarian territory using GIS. It examines some problems that
arise in thematic mapping for disaster management in case of earthquake
due to the various types, structure and classification of data provided
by various organizations. Main stages for data harmonization including
georeferencing the information into a geographical reference system,
standardizing the object classification, standardizing the level of
detail, unifying the cartographic visualization are discussed and some
advantages of the use of thematic maps for disaster management in case
of earthquake are presented. The resulted maps aim to contribute to
holistic seismic risk estimation for the territory of Bulgaria. These
maps, logically coupled with the all information data set that has been
collected and systematized within the framework of this project, would
provide useful information for decision makers and stake holders,
dealing with earthquake risk mitigation.
1. INTRODUCTION
Expert evaluations of seismic risk assessment is based on the
expected damage and opportunities for disruption of the status of
various systems such as destruction, impaired functioning, capacity
reduction, etc. as a result of an earthquake (Kouteva-Guentcheva and
Pashova, 2014). The success of disaster management depends on
availability and effective use of information (Altan and Kemper, 2010).
For disaster management in case of earthquake the responsible
authorities need a large amount of data - the experts involved in
earthquake risk estimation need various data such as: seismic hazard
information, geological information, building stock information,
demographic and social information, business / communications / industry
information, infrastructure information - Figure 1 (Pashova et al.,
2015; see this issue).
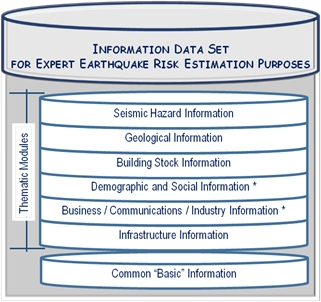
Figure 1. Information data set for Expert earthquake risk estimation
purposes
Cartography plays a very important role in presenting all these data on
special maps intended to be used for disaster management in case of
earthquake. Konecny and Bandrova (2006) have formulated the role of
cartography in disaster management “to simplify and well-arrange
required spatial data” thus the decision-making process to become
quicker and better and to lead to damage minimization. Different authors
work on mapping of seismic hazard information and geological
information. This paper is focused mainly on thematic mapping of
demographic and social information and business / communications /
industry information.
Generally, the visualisation of information depends not only on the type
of data but also on the type of user, including gender, age, disability,
behaviour, preferences, habits, task responsibilities, and other
characteristics. Many current products (e.g., maps, images, web sites,
and 3D environments) for crisis management borrow the colour schemes,
symbols, and maps’ content from existing, application-oriented software,
systems, models, and visualisations (Bandrova et al, 2012).
This paper presents newly compiled maps that take part of the integrated
information dataset, which has been collected within the framework of
the BN 164/14 CNIP-UACEG research project (Kouteva-Guentcheva, 2015).
The project deals with expert earthquake risk estimation, based on
holistic multidisciplinary approach involving processing in GIS
environment. Selected GIS layers will be the initially set of collected
maps describing the earthquake hazard available from various sources and
maps of different elements exposed to risk, particularly created maps
related the building stock, population in major cities, health
institutions, construction business statistics, infrastructure (Pashova
et al., 2015, see this issue). The conceptual model of Information Data
Set for the purposes of expert earthquake risk estimation, which
consists of five thematic modules and one common “basic” data module, is
shown in figure 1. The multiple datasets modules contain specialized
texts, maps, graphs, data tables in specific formats. Considering the
potential of the maps with regard improving the disaster management
process, this paper deals with the following two thematic modules: (i)
Demographic and Social Information and (ii) Business / communication /
industry information. All data, used for preparation of these maps are
available from the site of the National Statistical Institute,
http://www.nsi.bg/en
2. THEMATIC MAPPING FOR EXPERT EVALUATIONS OF SEISMIC RISK
ASSESSMENT
Effective disaster management and decision making in case of
earthquake require accurate information in the right place at the right
time. Depending on the role of participants in these activities, they
need specialized geographic information to support their specific
actions (Marinova, 2014). Main source of such information are thematic
maps, which serve as a tool for risk assessment. The expert risk
estimation is based on a quantitative definition of risk coupling "V =
vulnerability", "H = hazard" and "E = exposed elements or assets"
(Varnes, 1984). Among the available different extended definitions of
vulnerability, the United Nations/International Strategy for Disaster
Reduction (UN/ISDR), for example, defines vulnerability as the
“conditions determined by physical, social, economic and environmental
factors or processes which increase the susceptibility of a community to
the impact of hazards (UN/ISDR, 2004). The multidisciplinary holistic
risk estimation approach aims to measure risk and vulnerability through
selected comparative indicators in a quantitative way in order to be
able to compare different areas or communities (Davidson and Shah, 1998;
Vahdat and Smith, 2010 and references in). For this reason the risk
estimation procedure in general starts with defining the scope of
analysis and the corresponding indicators that may contribute in the
risk’s elements.
The risk for human life depends on the natural conditions in combination
with the activities of the population and whole society (Heitner, 1969).
Considering these factors and the importance of the demographic and
social information combined with business / communications / industry
information for the reliable earthquake risk assessment, some of the
maps that were prepared within the framework of the Research project
BN164/14-CNIP-UACEG (Kouteva-Guentcheva, 2015) are the following:
- Maps representing short-term statistics on residential
buildings;
- Maps representing housing fund - useful living area;
- Maps representing business statistics - number of building
permits;
- Maps representing business statistics - sectorial statistics -
average annual prices;
- Maps representing information society - household access to the
Internet;
- Maps representing demographic statistics - population density;
- Maps representing demographic and social statistics –
urbanization;
- Maps representing health sector - number of hospital beds.
In addition the following topical raster maps (Bandrova, 2008) were
scanned and processed to be included in the Generalized Information Data
Set for Seismic Risk Evaluation:
- Urbanization process;
- Transport infrastructure- density of the international /
national / regional network;
- Mining and quarrying;
- Electricity network;
- Chemical industry;
- Others.
All these maps provide useful information for different risk
assessments and further risk mapping that would help decision makers and
stake holders to understand the needs for sustainable planning and to
support the integrated crisis management (Altan and Kemper, 2010).
The mapped information might be used for different aspects of the
earthquake risk evaluation and damage prevention – e.g. loss
estimations, cost analysis, insurance policies. The latter are
determined differently and can vary widely depend on several factors –
e.g. location that reflects the level of seismic hazard, time of design
and construction, building structure type, number of floors, etc.
Regarding the building stock, pursuant to the Law for Census of
Population and Housing in the Republic of Bulgaria, in 2011 subject to
the census are residential buildings. The collected information on
existing buildings contains: type, location, number of floors, material
of which the building is constructed, the availability of solar panels,
year of construction, availability of a lift and number of dwellings in
the building. To our regret, these characteristics are considered
independently, e.g. the number of floors is not related to the
structural construction type or building material. The available
statistical information shows that almost more than 50% of the buildings
in Bulgaria were built before 1987 (National Strategic Plan for Building
Wastes Management and Demolishment for 2011-2014). They differ because
of the heterogeneity of building structural systems, materials used, the
construction period and number of floors. The enforcement of building
codes is followed for buildings constructed during the last several
decades. Their design complies with a certain level of seismic
protection predefined by the building codes and standards in effect at
the time of construction.
2.1 Mapping Demographic and Social Information
The maps of short-term statistics on residential buildings,
representing the newly built housing constructions (pre-fabricated,
brick, concrete construction, etc.) indicates the relative ratio of the
different type of construction in the different regions of the country
and might provide information on various trends in the buildings
construction. The maps depicting new buildings with different
construction for 2010 (figure 2) and 2013 (figure 3) show that in 2010
are built mainly concrete structures, while in 2013 are built mainly
brick structures. Diminishing trend of this building construction is
observed in the last years. The highest rate of new construction in 2010
is observed in the regions along the Black Sea, followed by the Plovdiv,
Sofia and Veliko Tarnovo regions. The trend in 2013 is almost the same
with the exception of the Plovdiv region, which joined the regions with
highest rate of construction. It is worth mentioning that Plovdiv and
Sofia are among the regions that are exposed to the highest seismic
hazard in Bulgaria.
Further effort of our team will be targeted towards finding the relevant
way to tie these results with other available data for the building
stock and appropriate generalized vulnerability estimation. The most
advanced approach of assessing the vulnerability of the existing
buildings and structures, certainly, is to base this analysis on
particular computations targeted on representative buildings structural
systems. Due to the lack of such data, the vulnerability estimates of
the existing buildings stock for the purpose of this study will be based
either on the buildings classification, provided in the European
macroseismic scale EMS 1998 (Grunthal, 1998) or on the available data
published in the scientific literature. European Seismological
Commission (1998) states the differentiation of buildings into
vulnerability classes from A to F according to the type of building
structure: masonry, reinforced concrete, steel and wood. The damages of
the buildings under earthquake are associated with the type of the
structure. The Classification of damage covers five grades, starting
from Negligible to slight damage (Grade 1); Moderate damage (Grade 2);
Substantial to heavy damage (Grade 3); Very heavy damage (Grade 4);
ending with Destruction - Grade 5. For each intensity degree the effects
on population and buildings are described. Thus the vulnerability class,
damage level and population are integrated in the integrated
macroseismic intensity twelve degree scale. Suitable recent structure
topology for the Balkan countries was provided by the RISK UE Project,
in which buildings are classified according: (i) major material and
structural system (masonry, reinforced concrete, steel and wood); (ii)
number of floors and overall height – 3 classes high-, mid- and low-rise
and (iii) level of seismic code, used for design and construction of
particular building – N à no code; L à low code; M à moderate-code and H
à high-code (comparable with Eurocode 8).
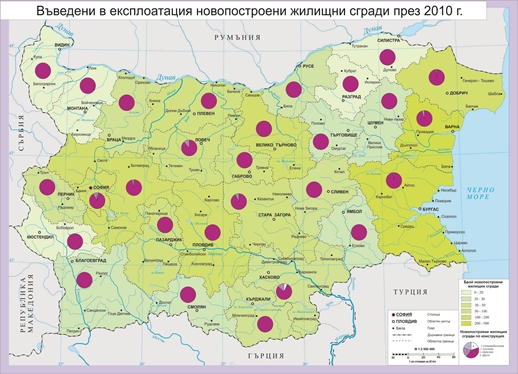
Figure 2. Map of newly built housing constructions for 2010.
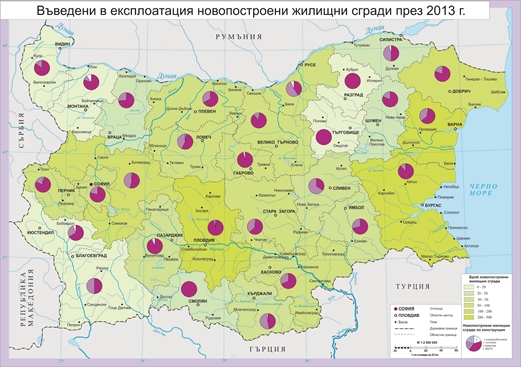
Figure 3. Map of newly built housing constructions for 2013.
Another quantity that is indirectly related to loss evaluation and
earthquake insurance industry is the useful living area of the housing
fund. Map of the housing fund - useful living area - for the year
2013 is shown in figure 4. The map representing useful living area for
2013 (figure 4) shows larger proportion to the cities – the largest one
is in Sofia (29-32 mln m2), followed by Smolyan, Kardzhali (24-29 mln
m2), Plovdiv (17-24 mln m2), Sliven, Varna and Burgas (11-17 mln m2).
Again one can see that the largest useful living area of the housing
fund is documented logically in the capital as well as in Plovdiv – both
cities fall in the zones of most severe seismic hazard in Bulgaria.
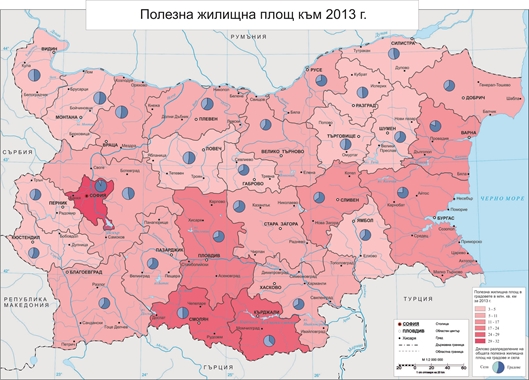
Figure 4. Map of useful living area for 2013.
Maps representing business statistics - number of building permits
issued in 2010 and 2013 are also prepared. The comparison between these
two maps has shown that the number of issued permits for construction of
administrative buildings in 2010 and 2013 (figure 5) is negligible
compared with that of housing and other buildings. Important indicator
is the growth of number of building permits in the regions,
characterized by recent urban sprawl and severe seismic hazard – the
Sofia and Plovdiv districts.
Other relevant to the earthquake risk evaluation are the maps
representing business statistics – building sectorial statistics in
terms of average annual prices for housing for the years 2010 and 2013.
The map representing average annual prices for housing for 2010 year
(figure 6) shows that the highest average annual market prices are in
the districts with higher living and lower unemployment. These districts
include the biggest cites in the country such as the capital Sofia,
Varna, Burgas, Plovdiv, Veliko Tarnovo, Pleven. Varna and Burgas
districts are bordering the Black Sea. There are a lot of summer resorts
and developed tourism and industry. The central and north central
districts are also with high average annual market prices because of
good living conditions there, developed industry and agriculture.
Compared to the average annual prices for housing in 2010 and 2013 is
noticeable that the prices in some districts decreased significantly,
but the developed regional centers retain their standard, e.g. Sofia,
Plovdiv, Varna, Burgas, Ruse. Information that this type of maps
represents is necessary for insurance compensation in case of
earthquake.
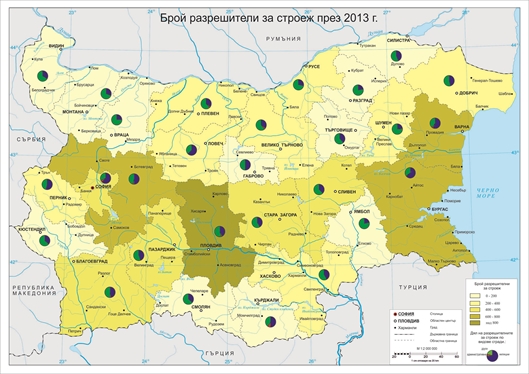
Figure 5. Map of the building permits number for 2013.
A map representing Information Society based - household access to the
Internet for 2013 is shown in figure 7. Fortunately, the districts
exposed to the most severe earthquake hazards in Bulgaria (Sofia and
Plovdiv) are well equipped in terms of internet information service. It
might be very important that inhabitants of affected by earthquake areas
can be informed on time and to receive constantly updated information in
the case of natural disaster and particularly earthquake and/or some
co-seismic negative consequences. Informed Society also concerns the
possibilities for preventive measures based on risk related information
published in the Internet.
Data for household access to the Internet can be considered as not
classified one. This means that we can speak about big data (BD) and a
possible manipulation with it. It could be verified, certified and GIS
specialist should find way how to use it. The insufficiency of current
software solutions and systems is supported by other researches:
„Typically, big data problems cannot be solved with the computing
resources that are available to most organizations. They require
clusters of computers running special applications, and might take days
or even weeks to complete” (Uganes, 2013). Behind the “special
applications” are the experts’ knowledge and experience in retrieving
valuable information. That is why the need of GI specialists is
recognized worldwide. In the past, software solutions replaced people in
order to avoid errors. With BD, we are turning back to the expert who is
invoked to propose next generation technology solutions, combining
multidisciplinary approaches (Bandrova et al, 2014).
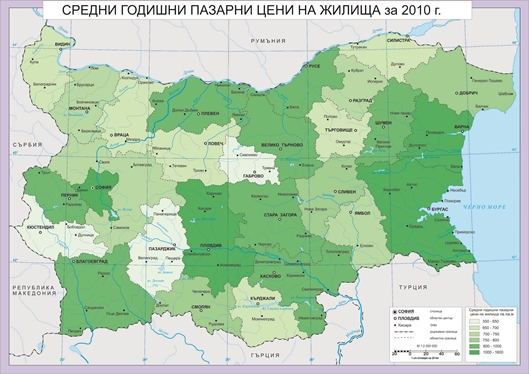
Figure 6. Map of average annual prices for housing for 2010
2.2 Mapping Business Communication and Industry
Information
Following the conceptual scheme of the Information Data Set given in
figure 1 and the general procedure for expert earthquake risk evaluation
(Pashova et al., 2015, this issue) available published maps (Bandrova,
2008) were scanned and made available as raster images.
These maps concern the urbanization process that is observed to be
stronger and faster in the high earthquake hazard districts. Evaluating
the urbanization process should go in parallel with numerous data
including housing information and population distribution models. Given
the absence of detailed housing information, one has to resort to
approximate models. Often villages contain fundamentally different
building compositions of structures than in the cities and for this
reason for some countries, different housing inventories are given for
two classes: urban and rural (Wyss, 2014). Settlements with the same
population numbers may have different building inventories because they
may be predominantly administrative, agricultural, touristic, or
industrial towns and villages. In parallel, maps representing the
transport infrastructure - density of the international, national and
regional network; mining and quarrying; electricity network; chemical
industry, hospital density have been prepared as raster maps to be
included in the basic dataset considered in the BN 164-14 UACEG Project.
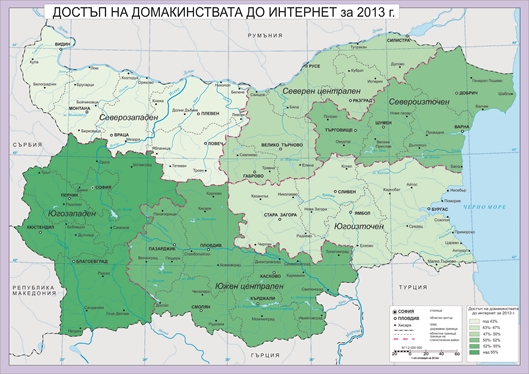
Figure 7. A map presenting household access to the Internet for 2013
3. DATA HARMONIZATION
Maps for disaster risk assessment in case of earthquake combine
international, regional and local data provided by various services,
agencies and organizations. The data gathered from various numerous
sources as geographic database; topographic maps; thematic maps;
Disaster management plan; seismic hazard information; geological
information; building stock information; demographic and social
information; business / communications / industry information;
infrastructure information; statistical data, etc. is heterogenic and
its use for crisis management is not easy. Therefore, the data should be
integrated and presented in the most appropriate way to assist specific
tasks of participants in all stages of disaster risk assessment (Parker
& Stileman, 2005). In order all these data to be integrated and
presented on the maps it should be harmonized according to the main
aspects of data harmonization (Gruber et al. 2006):
- georeferencing the information into a uniform reference system;
- standardizing attribute structure;
- standardizing object classification;
- standardazing level of detail;
- and unifying cartographic visualization.
4. CONCLUSIONS
Earthquake risk evaluation encompasses rather heterogeneous
information data sets. The integration of these data in a uniform data
base requires a lot of multi- and inter-disciplinary efforts.
Calibration and verification of the data sets and methods used is
important to continue, since to proceed further with the comparative
analysis of the available maps and the consequent risk evaluation in GIS
environment it is necessary to have at disposal compatible vector maps
and/or digitized raster maps with significant resolution. It would be
useful and interesting to perform the risk evaluations with different
available maps, so some useful observation in terms of sensitivity of
the final risk evaluation with regard to different input data sets could
be performed.
ACKNOWLEDGEMENTS
Research project CNIP-UACG БН – 164/14 is kindly acknowledged.
REFERENCES
Altan, O., Kemper G. (2010) Spatial Information for Disaster
Management Using Examples from Istanbul; M. Konecny, S. Zlatanova, T.
Bandrova (eds.), Geographic Information and Cartography for Risk and
Crisis Management, Lecture Notes in Geoinformation and Cartography, DOI
10.1007/978-3-642-03442-8_2, © Springer-Verlag Berlin Heidelberg
Bandrova T. (2008) Atlas on Geography and Economics, 10. Grade,
DataMap-Europe Ltd., Sofia, ISBN: 9789548717977
Bandrova T., Konecny, Yotova A. (2014) Cartography Development and
Challenges on the Basis of Big Data 5th International Conference on
Cartography and GIS, e-Proceedings, publisher: Bulgarian Cartographic
Association, Riviera, Bulgaria, ISSN 1314-0604, pp. 164-173,
http://cartography-gis.com/docsbca/5ICCandGIS_Proceedings.pdf
Bandrova, T., Zlatanova S., Konecny M. (2012) Three-Dimensional Maps for
Disaster Management, ISPRS Ann. Photogramm. Remote Sens. Spatial Inf.
Sci., I-4, 245-250, doi:10.5194/isprsannals-I-4-245-2012, Melbourne,
Australia,
http://www.isprs-ann-photogramm-remote-sens-spatial-inf-sci.net/I-4/245/2012/isprsannals-I-4-245-2012.pdf
Davidson R., H. Shah (1998) The Earthquake Disaster Risk Index: A
holistic Comparison of Earthquake Risk in Cities Worldwide, Project
”Understanding Urban Seismic Risk around the World”, part of the RADIUS
initiative of the INNDR Secretariat
European Seismological Commission (1998) European Macroseismic Scale
1998, Grundhal, G. (editor), Luxemburg
Gruber K., Moser M., Pitacco S., Benvenuti A., Cucek-Kumelj M., Schabl
A., (2006), Harmonisation of regional data resources for cross-border
project. Final Broschure ISA-Map, 2006
Heitner K. L., A (1969) Mathematical Model for Calculation of the Run-Up
of
Tsunamis. Pasadena, California
Konecny M., Bandrova T. (2006) Proposal for a Standard in Cartographic
Visualization of Natural Risks and Disasters. International Journal of
Urban Sciences, Vol. 10, Issue 2, 2006, pp 130-139
Kouteva-Guentcheva M. (2015) Report on the Research project
BN164/14-CNIP at the University of Architecture, Civil Engineering and
Geodesy, Sofia
Kouteva-Guentcheva, M., L. Pashova (2014) Seismic risk management and
information systems, First scientific and practical conference with
international participation "Project management in construction ", 4 - 5
December 2014 г., UACEG, Sofia, Bulgaria (in print)
Marinova, S. (2014) Thematic Mapping and Visualization for Early Warning
and Crisis Management, the University of Architecture, Civil Engineering
and Geodesy, Sofia
National Statistical Institute (2014), http://www.nsi.bg/, accessed
October 2014
National Strategic Plan for Building Wastes Management and Demolishment
for 2011-2014 (2011) (in Bulgarian)
http://www3.moew.government.bg/files/file/POS/Strategic_
documents/NSPUOSR-final.pdf
Parker, C., M. Stileman (2005) Disaster Management: the Challenges for a
National Geographic Information Provider, Geo-Information for Disaster
Management,, Springer, ISBN: 3-540-24988-7
Pashova L., Kouteva-Guentcheva, M., Badrova, T. (2015) Review and
Systematization of the Available Data for Earthquake Risk Mitigation in
Bulgaria Using GIS
Uganes, C., (2013), Social Media, Big Data and Visualization.
http://blog.hootsuite.com/social-media-big-data/ Accessed: 2. Jan. 2014
United Nations International Strategy for Disaster Reduction (UN/ISDR
2004) Living with Risk – A Global Review of Disaster Reduction
Initiatives. 2 vols. Geneva: United Nations.
Vahdat, K. and Smith, N.J. (2010) Multidisciplinary Integrated Tools in
Seismic Risk Management, 18th CIB World Building Congress, May 2010
Salford, United Kingdom, Lastly visited at available at
http://www.irbnet.de/daten/iconda/CIB19110.pdf
Varnes D.J (1984) "Landslide Hazard Zonation: a review of principles and
practice", UNESCO, Paris, 63p.
Wyss M. (2014) Ten Years of Real-time Earthquake Loss Alerts, Chapter 6,
http://dx.doi.org/10.1016/B978-0-12-394848-9.00006-7, International
Centre for Earth Simulation (ICES), Geneva, Switzerland Earthquake
Hazard, Risk, and Disasters.
BIOGRAPHICAL NOTES
Dr. Eng. Silvia Marinova
Dr. Eng. Silvia Marinova is General secretary of Bulgarian
Cartographic Association and Assist. Prof. at the University of
Architecture, Civil Engineering and Geodesy, Sofia. She is also a member
of Bulgarian Chamber of Graduated Surveyors, International Society of
Digital Earth and International Cartographic Association - Commission on
Cartography in Early Warning and Crisis Management. She works at KartGeo
Ltd. as a cartographer where her main activities are map design and
editing. Her science interests are focused on thematic mapping for early
warning and disaster management, cross-border mapping, mountain
cartography.
Prof. Temenoujka Bandrova
Prof. Temenoujka Bandrova is the President of the Bulgarian
Cartographic Association and head of the Laboratory on Cartography and
Erasmus coordinator for the Faculty of Geodesy at the University of
Architecture, Civil Engineering and Geodesy, Sofia. She is Co-chair of
the ICA Commission of Cartography and Children (2007-2011), а member of
the Council board and a chair of Young Scientific Commission of
International Society of Digital Earth (ISDE), a member of Commissions
on Map Projections, on Cartography in Early Warning and Crises
Management – International Cartographic Association (ICA); of the
Association for Geospatial Information in South-East Europe (AGISEE); of
Editor’s group of the International Journal of Digital Earth,
Cartographia and Geoinformatika, Croatia. She is Project manager in
DataMap Ltd. where her school atlases and maps are published. She is an
author of 30 school atlases and more than 80 wall maps in geography and
history, approved by the Ministry of Education and Sciences for
Bulgarian schools. She published more than 100 articles, reports,
papers, book chapters and edited books published by Springer and ESRI
Press. She is the organizer of series of 5 International Conferences on
Cartography and GIS.
Assoc. Prof. Mihaela Kouteva-Guentcheva
Mihaela Kouteva-Guentcheva is Associate Professor in the
Department of Computer Aided Engineering at the University of
Architecture, Civil Engineering and Geodesy, Sofia since 2013. She has
worked for more than 20 years in the Central Laboratory for Seismic
Mechanics and Earthquake Engineering at the Bulgarian Academy of
Sciences (BAS), later Earthquake Engineering Department at National
Institute of Geophysics, Geodesy and Cartography - BAS. She holds M.Sc.
degree in "Civil Engineering – Structural Engineer” and “Applied
Mathematics and Informatics” and PhD in “Solid Mechanics” in field.
Junior associate at the Abdus Salam International Centre for Theoretical
Physics – SAND Group, Trieste, Italy, 2001-2008. Her research and
publications are focused on topics in engineering seismology and
bridging engineering seismology with earthquake engineering, including
strong motion data analysis, seismic wave propagation modelling,
earthquake scenarios and seismic microzonation, dynamic analysis of
structures. She leads and participated in several projects in the field
of geodesy and geodynamics at national and international level.
Eng. Stefan Bonchev
Eng. Stefan Bonchev is an engineer at the Laboratory on
Cartography, University of Architecture, Civil Engineering and Geodesy,
Sofia. He holds a Master's Degree in Geodesy and Cartography. His
scientific and professional interests are focused on 3D cartographic
modelling. He graduated a Training School “3D Geoinformation for
Disaster Managment” in 2009 by COST Action TU0801 “Semantic enrichment
of 3D city models for sustainable development” organized in Delft —
Arnhem — Amsterdam, the Netherlands, 5-9 October 2009.
CONTACTS
Dr. Eng. Silvia Marinova
Bulgarian Cartographic Association
1, Chr. Smirnenski Blvd.
1046 Sofia, BULGARIA
Tel. +359 888 244348
Email:
silveto_marinova@yahoo.com
Web site:
www.cartography-gis.com
Prof. Dr. Eng. Temenoujka Bandrova
Bulgarian Cartographic Association
1, Chr. Smirnenski Blvd.
1046 Sofia, BULGARIA
Tel. +359 887 832702
Email: tbandrova@abv.bg
Web site:
www.cartography-gis.com
Assoc. Prof. Dr. Mihaela Kouteva-Guentcheva
Department of Computer Aided Engineering, Faculty of Structural
Engineering
University of Architecture, Civil Engineering and Geodesy
1, Chr. Smirnenski Blvd.
1046 Sofia, BULGARIA
Tel. +359 889 327327
Email:kouteva_fce@uacg.bg;
mkouteva@gmail.com
Web site: www.uacg.bg
Eng. Stefan Bonchev
University of Architecture, Civil Engineering and Geodesy
1, Chr. Smirnenski Blvd.
1046 Sofia, BULGARIA
Tel. +359 888 773767
Email: bonchev_st@abv.bg
Web site: www.uacg.bg
Web site:
www.cartography-gis.com
|


