Simulation Models to Test Improvement Proposals
in Land Administration Before Investing
[Special reference to Developing
Countries]
Ken Lyons, Australia
This article in .pdf-format
(16 pages)
SUMMARY
Simulation is used in business to develop and test business plans
before investing. To the author’s knowledge this does not occur in
LA (administration) in development, although the literature and
anecdotal comments indicate that widespread success and
sustainability remains elusive. This is seen as a capability gap.
Strategy Dynamics uses simulation and focuses on improving the
performance of a system. Its application to LA is illustrated in
examples showing how proposals to improve performance can be tested
both for effectiveness with aid and sustainability post aid, before
investing. Using the simulation model as a living business model
during implementation is also shown. The examples demonstrate that
simulation models can be used to close the capability gap. They are
a new tool for the LA toolbox.
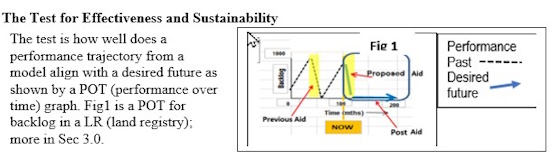
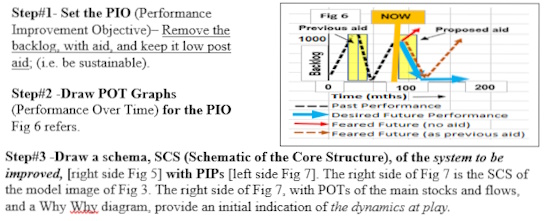
1. THE NEED - FOR A PERFORMANCE IMPROVEMENT TESTING TOOL
A Capability Gap Exists - Simulation models are
routinely used to develop and test business plans before investing. To
the author’s knowledge, they have not been used in land administration
(LA) for development, even though the literature and anecdotal comments
indicate that widespread success and sustainability remain elusive
despite much development assistance. This is seen as a capability gap.
Closing the Capability Gap using Simulation
Models enables:-
-
Testing proposed improvements for
effectiveness, with aid, and sustainability, post aid as well as
determining an improvement strategy before investment decision are
made.
-
The provision of a living business model (LBM)
during implementation The simulation model is not intended to be
predictive, but to simply provide insights. In this context
effectiveness is achieving project objectives and sustainability is
maintaining them with in-country budgets.
Acknowledgement - The advice from Dr Kim Warren of
Strategy Dynamics is gratefully acknowledged. All responsibility is the
author’s.
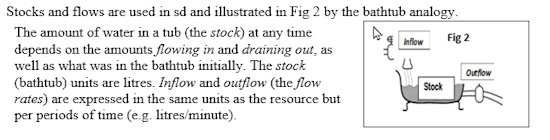
2. STRATEGY DYNAMICS -THE SIMULATION APPROACH USED
The simulation approach used is Strategy Dynamics (SD), Warren
(2009). SD focuses on improving the
performance of a system. SD enables:-
Determining if a plan will work;
Designing a system that can perform well;
Managing a system so that it does
perform well; Fixing a system when
problems occur. SD is based on system dynamics (sd).
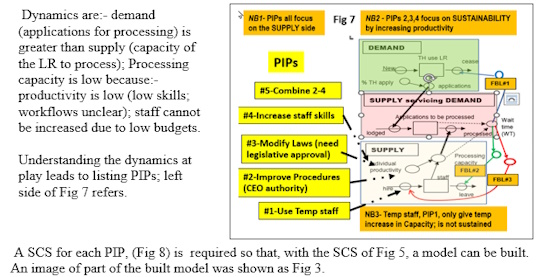
What a simple model looks like
-Fig 3 is an image of a model for a system of processing applications in
a land registry (LR). This model is developed in example 1, Sec 3.0.
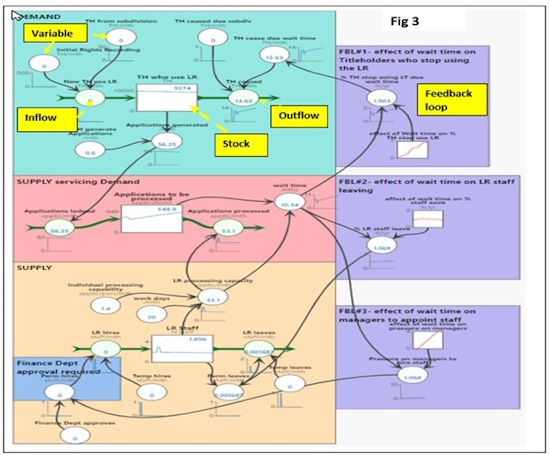
There are three main parts to the system;- a Demand side generating
applications; a Supply side with processing capacity; a Supply servicing
Demand which can give rise to waiting times, which in turn gives rise to
feedback loops (FBL). FBL#1 is where titleholders cease using the LR
because of long waiting times. More in Sec 3.
The examples used to illustrate the SD approach Four
examples are outlined in this paper. Example
1:(Sec 3) Removing a backlog in a LR.
Example 2:(Sec 4) Improving quality in a LR, winning back
customers; achieving financial sustainability.
Example 3:(Sec 5) Quality has
subcomponents under the control of different agencies.
Example 4 :(Sec 6) Raising development
capital if banks accept titles as collateral. Full details in Lyons
(2022).
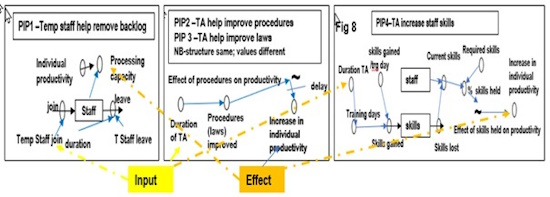
3. EXAMPLE 1- REMOVING A
BACKLOG IN A LR AND KEEPING IT LOW
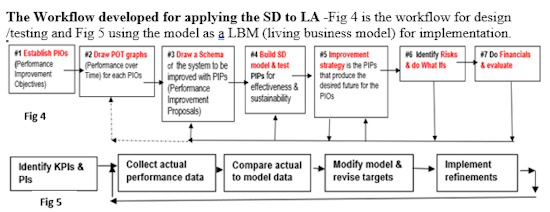
3.1 Applying the workflow to test Performance Improvement Proposals
(PIPs) [Fig 4]
3.2 Results - from using the model to test the PIPs for
effectiveness and sustainability
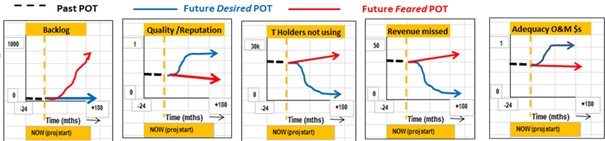
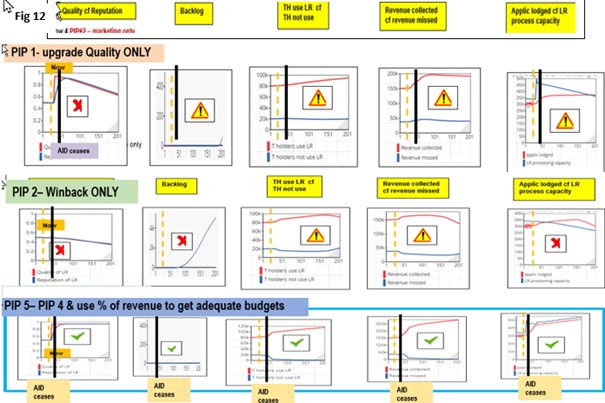
The test was outlined in Sec 1.0 and Fig 1. Fig 9 shows the results
of testing the PIPs. [PIP and PTI are used interchangeably]. The first
column shows the POTs for backlog, the PIO (a KPI, key performance
indicator), from testing each PIP. Other columns show POTs from the
model for other KPIs/PIs. The other KPIs/PIs can be identified from an
understanding of the model shown as Fig 3. Together they indicate the
likely effectiveness and sustainability of the PIPs. Desired future POTs
can be compiled for the other KPIs/PIs.
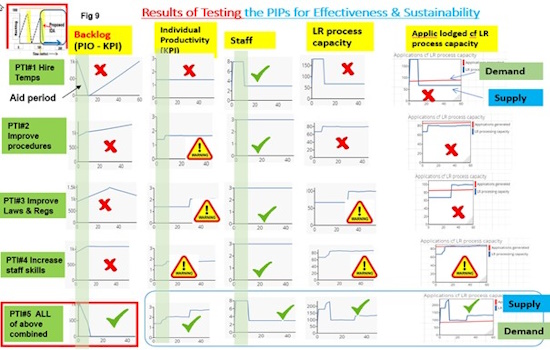
The improvement strategy should be based
on PTI#5 as it is the only one where the backlog trajectory from
the model aligns with the desired future for the PIO, and other KPIs/PIs
are improved . The improvement strategy in summary is:
(1) with aid – 5 temporary staff for 10 mths to assist
clear backlog; 3 TAs (technical advisers) for 6 mths to improve
procedures, laws, increase staff skills and productivity; executives
engage with politicians to pass changes to laws: (2)
post aid - executives engage with politicians until laws passed;
managers monitor actual performance to targets (covered in Example 3 Sec
4.0).
Take home points Example 1 -Simulation models can be
developed to test performance improvement proposals and determine an
improvement strategy before investing. Full details including risk What
Ifs and financials in Lyons (2022).
4.0 EXAMPLE 2- INCREASING QUALITY
IN A LR, WINNING BACK CUSTOMERS, FINANCING SUSTAINABILITY
4.1 Applying the workflow Fig 4, to test PIPs
(Performance Improvement Proposals) The PIOs:- 1-Improve quality 2-Win
back titleholders not using the LR; 3-Increase revenue 4-Maintain low
backlogs 5-Make financially sustainable using some of increased revenue
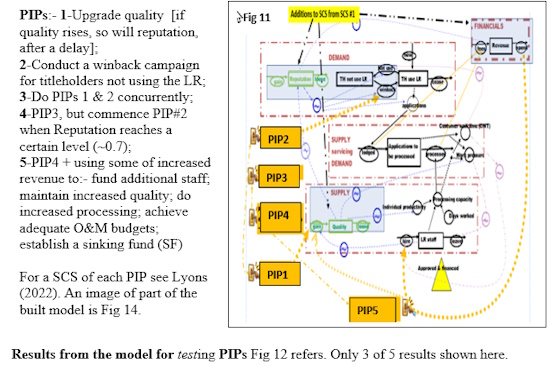
The improvement strategy should be based
on PTI#5 as it is the only one where the model trajectories align
with the desired future for the PIOs (POT graphs of Fig 10).
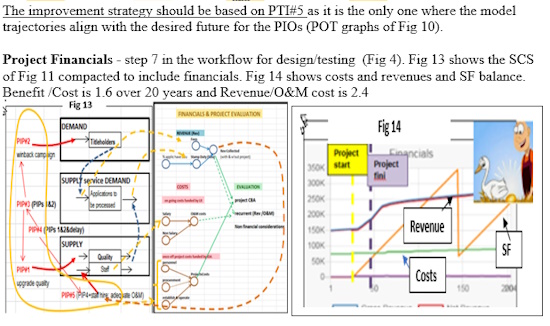
Project Financials - step 7 in the workflow for
design/testing (Fig 4). Fig 13 shows the SCS of Fig 11 compacted to
include financials. Fig 14 shows costs and revenues and SF balance.
Benefit /Cost is 1.6 over 20 years and Revenue/O&M cost is 2.4
The improvement strategy in summary is: 1.
with aid - use TAs, Staff (temporary and permanent) to upgrade quality,
conduct winback, increase staff skills and productivity, gain agreement
to retain some revenue. 2.
post aid - ensure budgets are adequate, maintain quality.
4.3 Using the sim model as a living business model (LBM)
during implementation [Fig 5] Fig 15 shows where KPIs/PIs are
in the model. Also shown are POT graphs for KPIs/PIs showing actual
performance (red lines) and targets (blue lines). The time is 7 mths
after aid, 23 months after quality upgraded; 8 months after winback
campaign finishes.
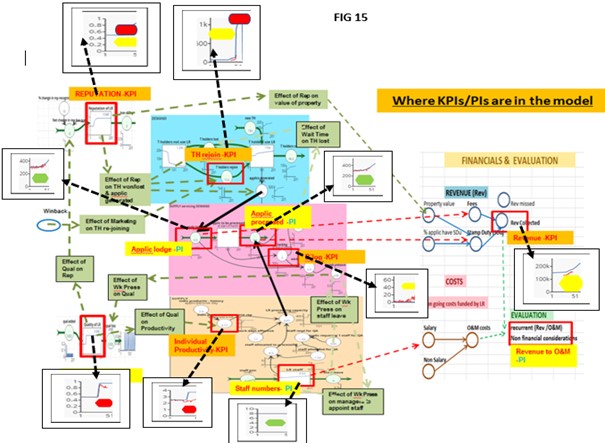
The colour of the “traffic light” in each POT graph indicates its
performance status. Red
is seriously below target viz Quality, Reputation, Individual
Productivity, Titleholders who rejoin the LR.
Yellow is of concern viz Backlog, Revenue.
Green is targets
largely being met viz Applications Lodged, Appliications Processed,
Staff numbers.
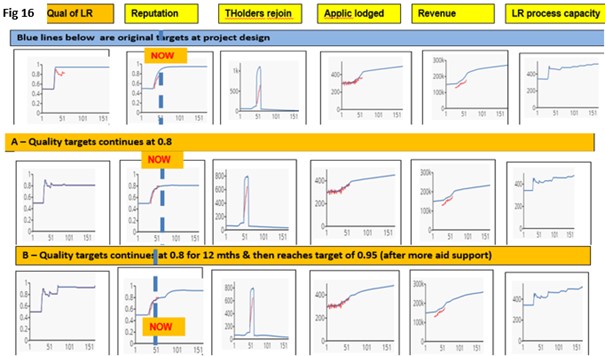
Evaluate and revise performance targets if necessary
– Managers decided to explore two What Ifs. What might be the target
performance of dependent PIs if (A) quality stays at 0.8? (the current
achieved level); or (B), continues at 0.8 for a further 12 months when
it reaches 0.95? (due to further aid). Fig 16 shows model results for
the two cases. The course of action selected is a management decision.
Take home points Example 2- 1. SD can be applied
when multiple PIOs and a more complex system exists. 2.
Clarity on the PIOs and their POTs is important. 3.
Budgets can be adequate and improvements sustained if some revenue is
reinvested. 4. Using the model to identify KPIs/ PIs
clearly identifies what affects what. 5. The model can also be used as a
LBM to assist implementation.
5. EXAMPLE 3 – IMPROVING QUALITY,
WHERE QUALITY COMPRISES SUB COMPONENTS UNDER THE CONTROL OF DIFFERENT
AGENCIES
Aim - To illustrate how quality can be treated when
it has subcomponents under the control of different agencies. Includes
the issues that arise.
A SCS for incorporating subcomponents into “the system
to be improved” - Fig 17 shows the LR system of Fig 11,
Example 2) on the right hand side, and the subcomponents of quality and
the responsible agency on the left. Each subcomponent (assumed for the
example) is shown as a stock with an inflow and outflow.
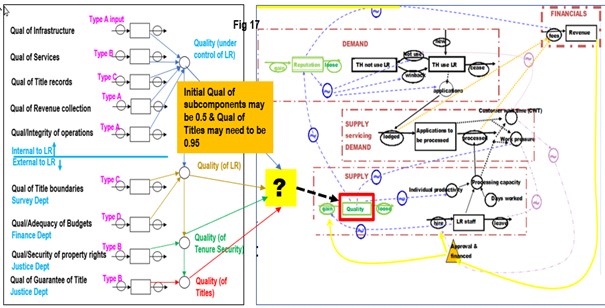
Depending on the combination of subcomponents, four different
measures of quality could be calculated; viz Quality under control of
LR; Quality of LR; Quality of tenure security; Quality of Titles.
SCS of the inputs to increase each quality
subcomponent are not shown, for brevity. In some cases there is
interdependency between subcomponents. e.g. quality of title records can
only reach a certain value (say 0.7), without access to reasonable
quality property boundaries, and then the two agencies working together
to raise their subcomponent to say 0.95. Four SCS input structures (Type
A,B,C,D) are annotated in Fig 17.
Effort, cost and time required to increase quality –
To increase any of the four calculated measures of quality it is
necessary to raise the quality of one or more subcomponents, (say from
0.5 to 0.95). The amount of work and cost to do this will likely vary
markedly. These costs flow through to the various calculated measures of
quality. Sufficient O&M budget is necessary to sustain each
subcomponent’s quality. Extra budget may well be required.
The Need for Clarity of the Aim
and Expected Outcomes when seeking to increase quality
where quality has subcomponents - Table 1 shows some possible aims and
outcomes.
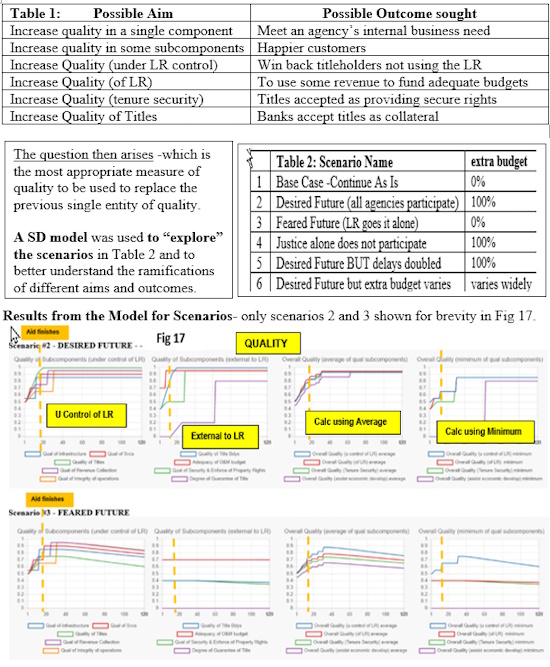
The scenario results indicate – that the desired
future is the only one where quality targets are achieved and sustained.
All others fall short by various amounts.
Take home points – Example 3:- 1. SD models can be
used to “explore”. 2. The cost and time to increase
“quality”, is dependent on the aim and outcome sought so it is vital to
have clarity of the aim and outcomes sought, before commencing.
3. Sustaining an increase in quality is largely dependent on
having adequate budgets which may require approval to use some revenue.
If quality is not sustained, the outcomes and initial investment will
decay as shown in scenario 3, Feared Future, Fig 17. 4.
It would be prudent to have cooperation agreements settled with other
agencies, including finance, before implementation.
6. EXAMPLE 4 – RAISING DEVELOPMENT
CAPITAL BY BANKS ACCEPTING TITLES AS COLLATERAL
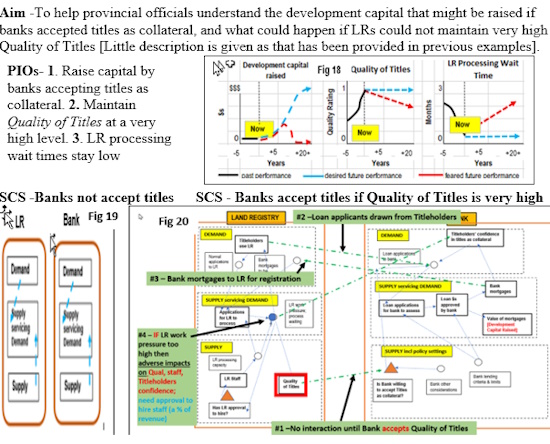
Scenarios - Base Case: Banks do
not accept titles as collateral; S1: Banks lend very
conservatively, and LR maintains a very high Quality of Titles;
S2: Banks lend less stringently, and LR maintains a
very high Quality of Titles; S3: S2 + an
increase in titleholders and LR maintains a very high Quality of
Titles; S4: S3 BUT LR unable to maintain a high
Quality of Titles
Results from the Model for Scenarios
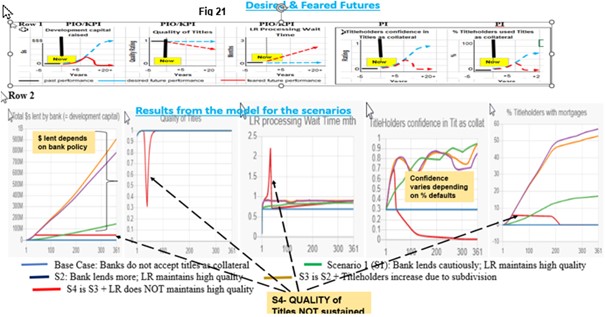
Take home points Example 4 – 1.
Simulation can be used to “explore or better understand”. A more
detailed model would be required if subsequent discussions with banks
were encouraging. 2. This model can be integrated with the model of
examples 2 or 3 if required.
7. OTHER EXAMPLES
Other examples in Lyons (2022) are:- Addressing
Informal Go Fast Fees; Skills development, increasing capacity; Options
for IRPR (Initial Recording of Property Rights) re cost, time and human
resources required; The scaling up of IRPR.
8. WRAP UP
8.1 How simulation models add value to
current approaches
SD adds value to qualitative methods like the logframe and
theory of change by:-
-
Being quantitative; no implicit assumptions;
handling indirect cause and effect
-
Enhancing stakeholder buy in by showing what
is to happen, how, by when
-
Extending timeframes past the periods of
aid, and examining sustainability post aid
-
Containing all aspects in a single model;
any change is immediately reflected throughout.
-
Being able to use models in project
appraisal, M&E, reviews, as well as in design
-
Models, being easily modified and components
used in new situations.
-
Being able to incorporate the pathways of
FELA (Framework for Effective LA) and FFP
8.2 Conclusions re using simulation
models for land administration improvement
The examples, while illustrative, are drawn from
the author’s field experience. They are considered a “proof of
application” of the use of simulation models for design, and as living
business models (LBM) during implementation. It is not necessary to
agree with the models illustrated. The important point is the SD
approach, its principles and logic. It demonstrates that simulation
models can be used to close a Capability Gap in LA development
assistance. They offer a new tool for the LA toolbox.
8.3 Taking it further
Time and effort needs to be invested to become
familiar and proficient with the SD approach. Such investment is
necessary for all new workplace tools, but yields a good return by
increasing the likelihood of success. Further steps could be:-
-
Form a community of interest in simulation
for LA, perhaps as part of an existing initiative of FIG Commission
7. Such a community could include a university with postgraduates
and a strong interest in LA in developing economies
-
Develop an online/hybrid course to provide
the knowledge and skills
-
Apply the SD approach to some past and
current LA projects and evaluate the results
REFERENCES
Lyons (2022), Land Administration: Improve
Performance by Testing, A Strategy Dynamics Approach, Special Reference
to Developing Economies.
https://landadminsystems.com . Warren (2019), Strategic Management
Dynamics, John Wiley & Sons Ltd.
https://strategydynamics.com/
BIOGRAPHICAL NOTES
Ken Lyons has had a long and varied career. In
later years over 20 years working on land administration development
projects in a variety of positions and countries. He holds Bachelor,
Master and PhD degrees. He is an Emeritus Professor of the University
of Queensland. After leaving academe he led his own consulting company
for 30 years. His early career was as an Australian army officer
specializing in surveying and mapping.
CONTACTS
Emeritus Professor Ken Lyons
PO Box 15
Montville QLD 4560
AUSTRALIA


