Article of the Month - February 2019
|
From a Property Tax to a Land Tax – Who Wins,
Who Loses?
Peter WYATT, United Kingdom

Peter Wyatt
This article in .pdf-format
(24 pages)
This paper has passed the FIG peer review and will be
presented at the FIG Working Week 2019 in Hanoi, Vietnam. The paper
looks at some of the consequences of switching from recurrent real
estate taxes that are based on improved values to one that is based on
the value of unimproved land. Focusing on one local authority area in
the south east of England, the paper answers the following questions:
how might the valuation of unimproved land be undertaken in a developed
economy where most transactional evidence relates to improved land, and
what are the revenue implications of switching from an occupier tax to
an ownership tax? In particular, who are the winners and losers and
does expansion of the tax base to include agricultural land uses make
much difference?
SUMMARY
Whilst the theoretical case in favour of a tax on the unimproved
value of land (a land tax) is well established, examples of its
implementation in practice are relatively few in number. Where a
land tax is levied, it is often part of a suite of land and property
taxes that includes transfer taxes, wealth taxes betterment and
recurrent taxes on improved land. Rarely is a land tax the sole
mechanism for taxing real estate. Yet there is no shortage of land
tax supporters, even in countries where other forms of real estate tax
have a long history. England is one such country, where real
estate taxes have existed since the 17th century in one form or another.
Despite strong lobbying at the beginning of the 19th century,
governments on the left, right and in the centre ground of political
discourse chose not to switch to a land tax.
In the land tax debate throughout this period, there was an absence
of empirical research to underpin the positions adopted by either
proponents of a land tax or defenders of the status quo. It was not
until 1964 that a small pilot exercise was undertaken to investigate the
implications of introducing a land tax in England. This seems odd
given that frequently cited criticisms of a land tax centre on its
practical difficulties. This paper, therefore, looks at some of
the consequences of switching from recurrent real estate taxes that are
based on improved values to one that is based on the value of unimproved
land. Focusing on one local authority area in the south east of
England, the paper answers the following questions: how might the
valuation of unimproved land be undertaken in a developed economy where
most transactional evidence relates to improved land, and what are the
revenue implications of switching from an occupier tax to an ownership
tax? In particular, who are the winners and losers and does
expansion of the tax base to include agricultural land uses make much
difference?
1. INTRODUCTION
Whilst the theoretical case in favour of a tax on the unimproved
value of land (a land tax) is well established, examples of its
implementation in practice are relatively few in number. Where a
land tax is levied, it is often part of a suite of land and property
taxes that includes transfer taxes, wealth taxes betterment and
recurrent taxes on improved land. Rarely is a land tax the sole
mechanism for taxing real estate.
Yet there is no shortage of land tax supporters, even in countries
where other forms of real estate tax have a long history. England
is one such country, where real estate taxes have existed since the 17th
century in one form or another. Despite strong lobbying at the
beginning of the 19th century, following the publication of Henry
George’s Progress and Poverty, governments on the left, right and in the
centre ground of political discourse chose not to switch to a land tax.
It is interesting to note that, in the land tax debate throughout
this period, there was an absence of empirical research to underpin the
positions adopted by either proponents of a land tax or defenders of the
status quo. The debate was a political, ideological and
theoretical one (McGill and Plimmer, 2004). It was not until 1964
that a small pilot exercise was undertaken to investigate the
implications of introducing a land tax in England. This seems odd
given that frequently cited criticisms of a land tax centre on technical
difficulties, and particularly the need to value unimproved land even
though most transactional evidence relates to improved land. It
would be useful to investigate these difficulties to see if
circumstances have changed. This paper, therefore, looks at models
of the possible consequences of switching from recurrent real estate
taxes that are based on improved values to one that is based on the
value of unimproved land. Focusing on one local authority area in
the south east of England, the paper seeks to answer the following two
questions:
- How might the
valuation of unimproved land be undertaken in a developed economy where
most transactional evidence relates to improved land?
- What are the revenue
implications of switching from an occupier tax to an ownership tax?
In particular, who are the winners and losers and does expansion of the
tax base to include agricultural land uses make much difference?
2. THE THEORETICAL CASE FOR A LAND TAX
The theoretical case for a recurrent tax based on the unimproved
value of land is well documented. Classical and neo-classical economists
such as Adam Smith, David Ricardo, John Stuart Mill and Alfred Marshall
demonstrated that the economic rent (and its capitalised equivalent,
value) which land is able to earn over and above the return generated
after optimally employing labour and capital is determined by its
scarcity and its location, neither of which are derived from any
productive activity on the part of the landowner. Land value is,
therefore, the price of monopoly: the scarcer and less substitutable a
parcel of land is, and the more attractive the location in relation to
the market and factors of production, the more valuable the land.
Land use planning and regulation, which are not the result of
landowner action, create further scarcity, increasing the value of land
in specific locations. At the land parcel level, the grant of
permission to develop land (including changing its use) can generate
substantial increases in land value. In societies where
governments provide infrastructure, services and amenities, landowners
may also benefit from value uplift as a direct result of this publicly
funded investment. Land value is argued to be, therefore, the
creation of the community and expresses, in financial terms, the right a
community has in land held by an individual.
Who receives economic rent depends on who owns the land and the
mechanisms in place to collect it. Debate over entitlement to
these legal rights over land (including the right to use, exclude
others, reap economic benefit, transfer, inherit, etc.) has a recorded
history of at least four centuries: whether such rights should be
privately owned and state protected (Locke, Bentham) or publicly owned
(Rousseau, Marx). As global population and the rate of
urbanisation increase, pressure on land resources grows, and the
philosophical debate over land rights intensifies with socioeconomic
concerns over access to and distribution of land and its associated
wealth (de Soto, 2000).
In countries where property rights are held privately, the
combination of private property rights and monopoly land value creates
two social costs: unearned land value (or wealth) and unequal
distribution of that wealth. One means of recovering unearned land value
is a tax. Adam Smith argued that a tax on land value would not
harm economic activity and would not increase land rents. The idea of a
recurrent tax on land value has been propounded ever since with 19th
century liberal economist Henry George making the most well-known case
for a single tax on land value (George, 2005). However, a single
tax on land that replaces all other taxes has not been introduced, the
most likely reason being that a wealth tax on such a scale could
dramatically reduce land values. Instead, the idea of a land tax
as a single land and property tax has been advocated, but these are
usually at low rates and capture only a small fraction of value.
Other reasons why land tax is regarded as beneficial:
- It does not distort choices as to how much to invest in
improvements (Dye and England, 2010)
- It can encourage optimum use of land (Commission on Local Tax
Reform, 2015 Vol 3, p.26-7) and reuse of vacant land (Lyons Inquiry
into Local Government, 2005, p.76)
- By raising the holding cost of land, it may discourage land banking
and speculation and encourage development
- It may encourage denser development (subject to planning) and
therefore limit urban sprawl
Although the theoretical case for taxing land is well established,
there are legitimate reasons for taxing improvements too.
Occupiers of improved land consume local services and benefit from
local amenities and this service provision needs funding, leading to
a case for taxing the value of improvements. Mirrlees et al (2011)
suggest that land and improvements should be thought of as distinct
bases for taxation, given that the investment in improvements does
not always correlate with the use of services. In reality,
many countries’ taxes are levied on their combined value and
therefore have what could be considered as a dual role: tax on
services used (waste collection, road repairs, etc.) and value of
land in the basis of its existing (i.e. unimproved) use. They
also argue that only residential improvements should be taxed since
business premises are an input into the production process so taxing
them would distort choices firms make about production (Mirrlees et
al, 2011:376).
Lichfield et al stressed the need to ensure land taxation is
compatible with development planning and Connellan (2004) explores
the moral and ethical rational for land taxation, as well its
practical operation in the UK. Dunne (2005) and Dye and
England (2011) also consider the practical issues associated with
land taxation. Lyons (2011), Lyons and Wightman (2013) and
Wightman (2013a and 2013b) investigate the potential for
implementing a land tax in the British Isles and in Ireland. More
recently, Corlett et al (2018) suggest replacing Business Rates and
Stamp Duty Land Tax on commercial transactions with a commercial
landowner levy, in other words a land value tax on owners.
3. LAND AND PROPERTY TAXATION
Despite the theoretical case for a tax on the unearned wealth
arising from land ownership, an all-encompassing land tax is a
rarity. Instead, a land tax usually sits alongside a gamut of
direct land and property taxes which can be classified in different
ways. Figure 1 categorises them as recurrent (usually annual) taxes
and event-based taxes. These taxes will directly affect land
value as the cost of the tax can be capitalised and deducted from
the price paid for land. In addition to these are indirect
taxes on land and property: VAT, which may be charged on the sale or
lease of commercial property; and income tax and corporation tax,
which are charged on rental income and profits from property
investment. These are less likely to be directly reflected as
capitalised deductions from land value as their incidence and
magnitude are dependent on taxpayer decisions and status.
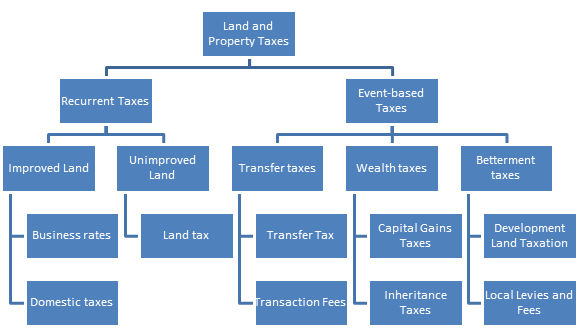
Figure 1 – Direct land and property taxes
Recurrent land and property taxes are usually assessed with reference
to value of unimproved land (a land tax) or improved land (a property
tax) and levied as a percentage of either the annual (rental) or the
capital value of the land parcel. Event-based taxes include
transfer taxes, wealth taxes and betterment taxes. Table 1 summarises
the key attributes of each of these taxes.
Table 1 – Key attributes of land and property taxes
|
Type of tax
|
Description
|
Recurrence
|
Liability
|
Incidence
|
| Recurrent tax |
A tax usually levied to help pay for local services |
Annual |
Occupiers or owners |
Occupation or ownership |
| Transfer tax |
% price agreed on transfer of ownership |
On transfer |
Owners |
Transfer |
| Betterment tax |
On increase in value attributable to granting of development
rights |
On grant of planning permission or commencement of
development |
Owners
|
General, scheme specific |
| Capital gains tax |
Accruing to property asset(s) whose value has appreciated
over time |
On realisation of chargeable capital gain |
Owners |
Wealth, Transfer |
| Inheritance tax |
On the value of property owned at death |
On death |
Owners |
Wealth, Transfer |
In England, all attempts to tax value arising specifically from the
grant of consent and the exercise of development rights, of which there
have been four since 1947, have been short-lived and resulted in failure
both in revenue terms and in bringing forward land for development.
What exists in terms of event-based land and property taxes is transfer
tax, capital gains tax, inheritance tax, and local betterment taxes (in
the form of ‘planning obligations’ and infrastructure levy).
England has two forms of recurrent land and property tax that are both
based on the improved value of land. These are Council Tax, which is
levied on domestic properties, and Business Rates levied on non-domestic
properties. The taxable entity for both of these taxes is the occupier
in the first instance, although owners become liable if the property is
unoccupied.
Council Tax is based on capital values of dwellings. Each local
authority administers and collects the tax and decides how tax revenue
is spent. There are eight council tax bands, from A (lowest) to H
(highest). These bands are based on estimations of the market value of
residential properties as at 1 April 1991. Local councils set the band D
tax rate, with the charges for properties in other bands being a fixed
proportion of that band D charge. Business Rates are based on
annual rental values and are revalued on a five-yearly basis. The
valuations are undertaken by a central government agency and the tax
rate is set by central government each year, but individual local
councils administer and collect the tax. Business Rates raise more
revenue than council tax despite a far smaller tax base. There are
a range of reliefs from these taxes; the main one is agricultural land
and buildings. Table 2 summarises the characteristics of Council
Tax and Business Rates.
Table 2 – Attributes of Council tax and Business Rates
|
Council Tax
|
Business Rates
|
| Based on value bands |
Based on spot values |
| Based on capital values |
Based on annual rental values |
| Local authorities set rate |
Central government sets rate |
|
Tax is collected by local authorities
|
| Occupiers liable (owners if property is empty) |
|
Based on 1991 values and never been revalued
|
Revalued every five years (seven years in one case)
|
| Various reliefs and exemptions, the main one being 25%
discount for single occupancy |
Various reliefs and exemptions, the main one being exemption
for agricultural land and woodland |
Council Tax is regressive in two ways. First, the tax rate declines
when moving from lower to higher value bands. Roughly speaking the
percentage increase in bills between bands is half the percentage
increase in property values (Hills and Sutherland, 1991). Second,
the absence of revaluations means that increases in land value are not
being taxed and geographical shifts in land value are not reflected.
For example, in 1995 the mean house price in the north east of England
was 29% below the mean for England and the south east was 20% above.
By 2017 the north east was 47% below and the south east was 25% above.
Figure 2 shows that values have shifted from the north to the south and
this is not reflected in the 1991 values. Leishman et al (2004)
looked at alternatives to the Council Tax system and Corlett and
Gardiner (2013) provide a critique of the Council Tax and suggests
replacing it with a progressive property tax. Business Rates are a
tax on land and improvements and therefore it is, at least in part,
economically inefficient as it taxes a production input. There are
also some discounts for empty properties and this is acts as a
disincentive for reuse.
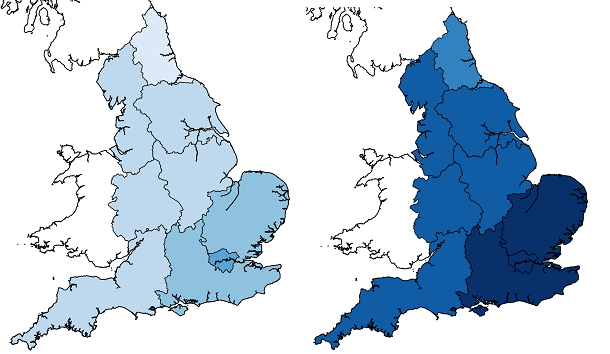
Figure 2 – Mean house prices in years ending Dec 1995 and Dec 2017
(dark shades are higher Council Tax value bands and light shades are
lower)
4. IMPLEMENTING A LAND TAX AS A REPLACEMENT FOR A PROPERTY TAX
There are a number of issues that need to be considered when deciding
whether to introduce a land tax as a replacement for an existing
property tax.
The first issue is the windfall loss incurred by owners of land as the
tax base shifts from occupiers to owners. The main losers when switching
from an occupation tax such as business rates to a land tax would be
land-extensive businesses (IPPR, 2005). A broader, more inclusive tax
base means that tax rates for everyone can be lower, but the UN (2011)
notes that taxation of agricultural land or forest land can be
politically sensitive. This may explain to some degree why many
countries with a land tax apply special reliefs to agriculture, through
full or partial exemptions, or lower tax rates (Norregaard, 2013).
Also, the impact on other taxes needs to be carefully considered.
Further, in most countries special provisions exist for heritage assets,
which are deemed to require protection.
Second, in their review of international literature, Gibb and Christie
(2015) note that there is a risk that introducing a land tax may
initially lead to significant land value reductions as a result of the
capitalisation of future tax liabilities into the value of land.
This could have significant implications for economies that rely on the
wealth stored in property values as collateral for debt. To
counter such a fall in values, a transitional arrangement might be
appropriate, perhaps phasing in the land tax or offering compensation to
those initially affected.
Third, because a land tax is usually levied on owners, this can cause
confusion over the purpose of the tax. Local taxation is often
regarded as a benefit or service tax to pay for the provision of local
infrastructure, services and amenities. Therefore, occupiers of
land, together with improvements to the land, would be the appropriate
taxable entities. However, if the tax is also in part a wealth tax
designed to capture uplift in value resulting from the provision of
local infrastructure, services and amenities, then the landowner would
be the appropriate taxable entity. In reality, a land tax is a
hybrid benefit tax and wealth tax. The confusion stems from the
fact that the tax is assessed by reference to values. Is the tax
based on values to capture greater taxes from those with higher value
properties or is it based on values because those living in higher value
properties will use infrastructure, services and amenities more?
Relatedly, the level of tax liability may not necessarily be correlated
with ability to pay, so a mechanism might be required for taxpayers to
defer payment until sale.
Turning to the more technical aspects associated with a land tax, it
requires a register of land ownership that records legally identifiable
boundaries and permitted land use and development rights for all sites.
England does not have such a legal cadastre. Moreover, England has
a plan-led discretionary system for allocating land use rights, which is
different from zoning systems that delineate permitted uses on an
area-by-area basis, conveying development rights to landowners without
the need for detailed approval. In a zoning system the assessment of
permitted use is more straightforward than a plan-led discretionary
system.
It may be difficult to value unimproved land. This is because
valuations rely heavily on the availability of evidence to support
assessed values, but evidence of sales of unimproved land, particularly
within urban areas is often difficult to find. An alternative is
to use an approach known as the ‘residual’ method, whereby build costs
and other adjustments are subtracted from the total value of the
development to arrive at a ‘residual’ land value. The approach is
used later in this paper, but it is worth noting here that it can
produce confounding results. For example, take two dwellings
side-by-side. One is three-storey and developed to highest and
best use (market value = £1m, build and other costs = £0.5m, so land
value = £0.5m), the other is two-storey (market value = £0.7m, build and
other costs = £0.3m, so land value = £0.4m). The land value (and
therefore the tax) of the first property is higher. The
relationship between property value and build cost is penalising the
development of land to highest and best use, which is counterintuitive
as far as a land tax is concerned.
This problem could be addressed by valuing the land on which the
two-storey property is constructed at its ‘highest and best use’, in
other words assuming that it is developed to three-storeys.
However, the difficulty then shifts to the identification of highest and
best use. One approach might be to make reference to planning
policy for each plot of land and make a judgement as to whether the land
is developed to its maximum reasonable capacity. However, this would be
open to challenge. It would also be labour intensive and costly.
Nevertheless, it is an approach used in some countries, but normally
where land use is ‘zoned’ for planning purposes. Each land use
zone is delineated and the highest and best use is established for each
zone, within which property of different types would be taxed based on
corresponding tax rates. This approach would need to be designed so as
to acknowledge that not all land within such zones would be permitted to
be developed to the zoned highest and best use by the planning system
e.g. land within the setting of a sensitive heritage asset, or land
which is used as public open space. Therefore, with a zoned
approach, some method is required to allow for adjustment at the
individual parcel level.
This raises another important point. With a zoning system it is
possible to base a land tax on the ‘planned’ use of each piece of land,
the ‘highest and best use’. A discretionary planning system means
that this is not possible since any change of legally permitted use only
occurs once an application to do so has been granted consent. What
this means is that the land value on which a land tax is based may be
assessed with reference to either its highest and best use (zoning
system) or its current use (discretionary system). The modelling
undertaken for this paper is based on the latter – current use.
Land tax is usually assessed as a proportion of market value[1]
of the (un)improved land but can also be based on market rental values.
Rental values relate to market conditions but normally reflect existing
use rather than how the property might be used if sold on the open
market. Basing the tax on capital market value means that valuations
will include ‘hope value’. This is the value that purchasers of
land pay in excess of the value for the permitted use. It reflects
– in financial terms – speculation that there might be a change of
permitted use that would increase the value of the land. Thus, if
a purchaser acquires land at a price that incorporates hope value, he or
she will be exposing themselves to a land tax liability based upon that
value. This point is explained in the quotation below.
‘Agricultural land at a city’s edge is often more valuable for its
development potential than for its agricultural production. If the land
is taxed at its ‘market value’, meaning its value as developable land,
farmers may not be able to continue farming because of high taxes. While
many countries simply exclude agricultural land from the tax base, many
others design a system which taxes agricultural land at its agricultural
value rather than full market value.’ (UN 2011: 43)
Basing land tax on assessments that include hope value could be open to
challenge since its existence and extent are matters of judgement.
It might therefore be preferable to value unimproved land based on a
highest and best use that could reasonably be assumed to be permitted
under existing local planning policy, rather than including a proportion
of value which is assumed to derive from the potential to gain a
planning permission for a different and more valuable use in the future
should planning policy change. If a ‘zoned use’ approach to planning is
taken, this simplifies the issue, but does give rise to the need for
‘parcel adjustments’ for site specific characteristics.
5. PREVIOUS STUDIES OF MOVING FROM A PROPERTY
TAX TO A LAND TAX IN ENGLAND
In 1964 the Rating and Valuation Association reported on a study that
investigated the hypothetical impact of a land tax or ‘site value
rating’ as it was referred to (Rating and Valuation Association, 1964).
This study piloted site value rating in Whitstable, a small town of
approximately 2,000 residents in the county of Kent in south east
England. Annual values of sites were assessed based on full
permissible development value in accordance with the ‘town map’.
All land was valued, including sites of churches and so on, which could
later be exempted as appropriate. The valuations were quite
fine-grained; site-specific aspects such as frontage and proximity to
value-enhancing and value-diminishing characteristics were taken into
account. Capital values were annualised at a rate of 4%. The
result of the study showed that the total value on the existing rating
list (based on occupied taxable units) was £724,100 whereas the site
value list (based on owned land units) was £642,254, of which £14,504
(2%) was from agricultural land.
A follow up study (Land Institute, 1973) used the same approach.
Interestingly, as far as the approach adopted in this paper is
concerned, the study found a ‘remarkable consistency’ between land
values obtained by deducting improvements from total sale price (i.e. a
residual approach), and the few transactions involving bare land that
were available at the time. As with the 1964 study, a relatively
ad hoc decision was made to use a rate of 6% to annualise capital
values. The 1973 study reported an increase in rateable value from
£3,186,543 under the existing rating system to £4,531,093 under a site
value rating system, opposite to the decrease reported in the 1964
study. There may be several reasons for this, but a likely
contender is the rapidly growing value of land over the decade.
Thirty years later McGill and Plimmer (2004) revisited the two
Whitstable pilot studies and, of particular relevance to this paper,
looked in some detail at the predicted winners and losers. Those
who stood to gain were owners of dwellings, retail, commercial and
industrial properties, schools and playing fields, hospitals and homes.
Some of the decreases in assessed value were substantial. Such
reductions can be countered by raising the tax rate but, unless
differential rates are implemented, there would be a significant shift
in relative liabilities. Increases in value related, in the main,
to public uses of land. The exception was agricultural land use, but
this was previously untaxed. What the study seems to show is that
replacing a property tax with a land tax means that, all else equal,
those who previously paid tax based on land and improvements now pay
less since they pay a tax based on land value only. However, the
tax burden may be redistributed so that those in the most valuable
locations pay the most tax, regardless of the value of improvements on
the land.
A great deal has changed since the Whitstable study and, given rising
land values resulting from increased development pressures, particularly
for residential development, it seems appropriate to look afresh at the
implications of a switch from a property tax aimed at occupiers to a
land tax aimed at owners.
6. METHOD
The method adopted for this research is a case study. Reading, a
large town situated 60 kilometres west of London in the south east of
England, was selected as the study location. The area is administered by
Reading Borough Council and has a population of approximately 163,000
residents and an area of just over 40 square kilometres. It comprises
mainly urban land uses but with some rural land uses, and a mix of large
and small owners and occupiers of land and property. Table 3
summarises the Council Tax base for the borough and Table 4 summarises
the Business Rates base.
Table 3: Council Tax in Reading, 2017-18
|
Band
|
Property value
|
Charge
2017/18 |
Number (and %) of dwellings |
Revenue before reliefs |
| A |
up to £40,000 |
1148.89 |
6,450 (9%) |
7,410,341 |
| B |
£40,001 to £52,000 |
1340.36 |
14,010 (20%) |
18,778,444 |
| C |
£52,001 to £68,000 |
1531.85 |
28,670 (41%) |
43,918,140
|
| D |
£68,001 to £88,000 |
1723.33 |
10,860 (15%) |
18,715,364 |
| E |
£88,001 to £120,000 |
2106.30 |
5,430 (8%)
|
11,437,209 |
| F |
£120,001-£160,000 |
2489.25 |
3,270 (5%) |
8,139,848 |
| G |
£160,001-£320,000 |
2872.22 |
1,840 (3%) |
5,284,885 |
| H |
£320,000 and over |
3446.66 |
80 (-) |
275,733 |
| TOTAL |
70,600 |
113,959,964 |
Table 4: Business Rates in Reading, 2017-18[2]
|
Land use
|
Number (and %) of properties
|
Rateable value
(% of total)
|
| Retail and Leisure |
2,158 (40%) |
£116,850,590 (37%) |
| Offices |
1,614 (30%) |
£111,142,825 (35%) |
| Factories and warehouses |
886 (16%) |
£46,842,495 (15%) |
| Other |
790 (15%) |
£38,515,553 (12%) |
| TOTAL |
5,448 |
£313,351,463 |
Council Tax revenue before reliefs was £114m spread over 70,600
dwellings, an average of £1,600 per dwelling. To calculate the
revenue from business rates it is necessary to multiply the rateable
value by the Uniform Business Rate (UBR). Small businesses – those
with a rateable value below £51,000 are assigned a lower UBR. The
total rateable value of these small businesses in the current rating
list for Reading is £55m. With a UBR of 0.466, this produces a
revenue before reliefs of £26m. The total rateable value of
properties with a rateable value of £51,000 or more is £258 million and,
with a UBR of 0.479, the gross revenue is £124 million. This makes
a total Business Rates revenue before reliefs of £150m, an average of
£27,000 per business property.
Net of reliefs, revenue from Council Tax in 2017/18 was £92 million,
equating to £1,300 per dwelling, and from Business Rates it was £124
million[3] equating to £23,000 per property.
The total recurrent land and property tax revenue for Reading in 2017/18
is, therefore, £216 million. To be revenue neutral, a land tax
must yield this amount of revenue.
Table 5 categorises land use in Reading and summarises their areas.
Figure 3 shows the 1,339 land use polygons on a map. In practice,
some uses are likely to be exempt from a land tax so only those shaded
will be included in the land tax valuation model.
Table 5: Land use in Reading
| Code |
Land use description
|
Area (m2)
|
| |
Inland water |
1,015,156 |
| |
Open or heath and moorland |
1,868,069 |
| a |
Agriculture - mainly crops |
4,704,744 |
| b |
Glass houses |
5,189 |
| c |
Farms |
19,138 |
| d |
Deciduous woodland |
662,151 |
| e |
Coniferous and undifferentiated woodland |
208,874 |
| |
Principal transport road |
5,382,868 |
| |
Principal transport rail |
342,836 |
| |
Recreational land |
3,322,058 |
| f |
Large complex buildings various use
(travel/recreation/retail) |
346,601 |
| g |
Low density residential with amenities (suburbs and small
villages/hamlets) |
15,421,783 |
| h |
Medium density residential with high streets and amenities |
4,029,255 |
| i |
High density residential with retail and commercial sites |
570,369 |
| j |
Urban centres - mainly commercial/retail with residential
pockets |
188,501 |
| k |
Industrial areas |
1,650,663 |
| l |
Business parks |
187,627 |
| m |
Retail parks |
245,176 |
| n |
Primarily large commercial/industrial sites |
213,022 |
Source: GeoInformation, compiled from Ordnance Survey Open Data and
aerial photos
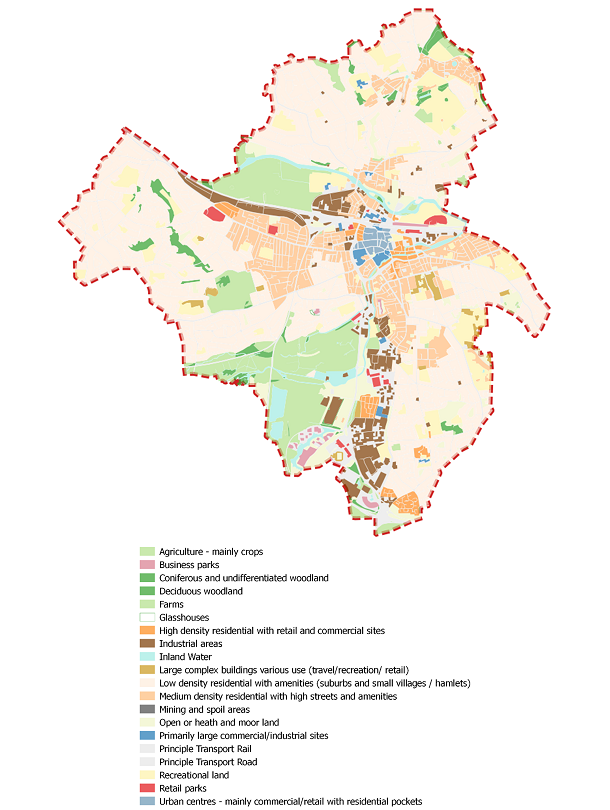
Figure 3: Land use in Reading
Source: GeoInformation, compiled from Ordnance Survey Open Data and
aerial photos
These land use areas were used to calculate the land tax revenue for
Reading using two valuation models, one acting as a cross-check on the
other. The first model was based on comparison with published land
value data and the second was a residual valuation model in which
estimated build costs are deducted from property values to arrive at
land values. Separate valuation models were constructed for the
non-domestic and domestic land uses listed in table 6.
Table 6: Land uses
|
|
Land Use
|
Land use code from
Table 4
|
|
| |
Agriculture |
a, b, c, d, e |
|
| |
Retail and leisure |
f, j/2, m |
|
| |
Office |
j/2, l, n/2 |
|
| |
Industrial and storage |
k, n/2 |
|
| |
Detached houses |
g |
|
| |
Semi-detached houses |
g |
|
| |
Terraced houses |
h |
|
| |
Apartments |
i |
|
The residual valuations were based on the land use specific
assumptions set out in table 7. The values of residential units
were based on transaction prices obtained from the Office for National
Statistics[4]. Rental values and investment
yields for retail, office and industrial space were obtained from CoStar[5].
Agricultural land values were not modelled, they were the same as the
comparison approach.
Build cost estimates[6] were obtained from the
Building Cost Information Service[7] of the Royal
Institution of Chartered Surveyors. Planning costs are assumed to
cover any planning obligations and community infrastructure levy that
may be required. Building sizes were obtained from CABE (2010) and
DLCG (2016). Development density or floorspace-to-land ratio is a
difficult metric to find evidence for. In 2017 the Government’s
Land Use Change Statistics recorded a density of 32 addresses per
hectare on for new developments, but higher at 40 addresses on
previously developed or brownfield land and lower at 26 addresses on
non-previously developed or greenfield land (MHCLG, 2018b).
Assuming an average dwelling size of 90m2 that equates to 4,000m2 of
residential floorspace per hectare, i.e. 40% density. Indicative
density for Reading town centre is 100 dwellings per hectare (dph) or
higher, for urban areas it is 60-120 dph and for suburban it is 30-60
dph[8]. The densities for town and city
centres – where apartments are assumed to be the predominant form for
residential development – is in line with the assumption made in DCLG
(2015)[9]. Densities for commercial land uses
are very difficult to find evidence for. Town centres may be close
to 100% site coverage, more for office space.
Table 7: Residual valuation assumptions
| |
Apart-
ments
|
Terraced houses
|
Semi-detached houses
|
Detached houses
|
Office (centre)
|
Office (out of town)
|
Industrial & storage
|
|
Values (£/m2)
|
£4,035 |
£4,456 |
£4,029
|
£4,796 |
£4,508 |
£3,607 |
£1,818 |
| Build cost (£/m2) |
£1,599 |
£1,332 |
£1,309 |
£1,534 |
£1,905 |
£1,500 |
£1,119 |
External works
(% build cost) |
15% |
15% |
15% |
15% |
10% |
10% |
10% |
Planning costs
(% value) |
15% |
15% |
15% |
15% |
5% |
5%
|
0% |
| Net:gross floor area ratio |
- |
- |
- |
- |
80% |
80% |
100% |
| Building size |
61 m2
(2-bed flat) |
71 m2
(2-bed house) |
96 m2
(3-bed house) |
121 m2
(4-bed house) |
- |
- |
- |
| Floorspace:plot size ratio[10] |
200% |
50% |
40% |
30% |
300% |
200% |
100% |
| Building period |
2 years |
2 years |
2 years |
2 years |
1.5 years |
1.5 years |
1 year |
In addition to the land use specific assumptions itemised in table 6,
the following generic assumptions were also made:
- Finance at 6% per annum on half build costs and fees over the
building period
- Land acquisition costs (Stamp Duty Land Tax plus legal and
agent’s fees) at 6.5% of land price
- Developer’s return at 20% of development value
- Fees for construction professionals at 12.5% of build costs
- Marketing and sale costs at 2% development value
The residual valuation model, and its application to each of the land
uses, is shown in the appendix. The gross development values of
the commercial and industrial land are very sensitive to the choice of
yields
7. RESULTS
Turning to the comparison valuation model first, this had to be
undertaken at a highly aggregated level due to the limited availability
of sub-regional land value data. The most up to date source of
land value data is the UK Government’s Ministry for Housing, Communities
and Local Government (MHCLG, 2018a). In 2015 land values were £4.9
million per hectare for residential development land in the Reading
local authority area and £2.0 million per hectare for industrial land.
Agricultural land value in the surrounding area of the Thames Valley and
Berkshire was estimated to be £22,500 per hectare. Office land
values for Reading were reported at £21.7 million per hectare for
commercial land on the edge of the town centre and £8.67 million per
hectare for commercial land on the edge of town or on business parks.
No land values were published for retail or leisure land uses so these
land uses were assumed to be valued at the same level as commercial
land.
The land values were used to calculate land tax revenue using the
comparison model. In order to generate the same level of
pre-relief tax revenue as the current property taxes, the tax rate would
need to be 1.90%. The resultant breakdown of values by land use is
shown in Table 8. Areas were estimated from the land use areas in
Table 5.
Table 8: Land tax results from the comparison model
|
Land Use |
Area (m2) |
Land value
(£/ha) |
Land Value (£) |
Tax revenue
(at a rate of
1.90%) |
Tax (£/m2)
|
| Commercial (city centre) |
188,501 |
21,700,000 |
409,047,717 |
7,771,907 |
41.23 |
| Commercial (out of town) |
885,915 |
8,670,000 |
768,088,627 |
14,593,684 |
16.473 |
| Residential |
20,021,408 |
4,900,000
|
9,810,489,806 |
186,399,306 |
9.31 |
| Industrial |
1,757,174 |
2,000,000 |
351,434,720 |
6,677,260 |
3.80 |
| Agriculture |
5,600,067 |
22,500 |
12,600,150 |
239,403 |
0.04 |
| TOTAL |
28,453,065 |
|
11,351,661,020 |
215,681,559 |
|
The comparison valuation model is broad-brush and based on limited
data relating to land values. The residual method offers a more ‘first
principles’ approach. It also provides an opportunity to
categorise residential land use into three distinct densities.
Table 9 shows the resultant land values from the residual model for each
land use together with the tax revenue. The land values are lower.
This is because the Government’s estimates of land value assume a
standard development with no abnormal costs and no planning obligations
or infrastructure levy. With the residual land values, a tax rate
of 3.00% is required to approximately match the revenue from the current
property taxes.
Table 9: Land tax results from the residual model
|
Land use
|
Area (m2) |
Land value (£/ha)
|
Land value (£)
|
Tax revenue
at a rate of
3.00%
|
Tax (£/m2)
|
| Commercial (city centre) |
188,501 |
22,315,579 |
420,651,465 |
12,619,544 |
66.95 |
| Commercial (out of town) |
885,915 |
11,902,038 |
1,054,419,865 |
31,632,596 |
35.71 |
| Residential (low density) |
15,421,783 |
2,441,527 |
3,765,269,469 |
112,958,084 |
7.32 |
| Residential (medium density) |
4,029,255 |
3,349,019 |
1,349,405,153 |
40,482,155 |
10.05 |
| Residential (high density) |
570,369 |
9,269,725 |
528,716,808 |
15,861,504 |
27.81 |
| Industrial |
1,757,174 |
125,137 |
21,988,727 |
659,662 |
0.38 |
| Agriculture |
5,600,067 |
22,500 |
12,600,150 |
378,004 |
0.07 |
| TOTAL |
28,453,065 |
|
7,153,051,636 |
214,591,549 |
|
The proportion of total tax revenue that is generated by agricultural
land is very small, although it should be noted that the amount of
agricultural land in the Reading borough is very low. By far the
largest proportion of tax revenue is generated from low density
residential and this is likely to be the case for many parts of England,
particularly in the south east, because of the combination of high land
values and low density (land extensive) development.
So the taxable land in Reading is valued at a total of £7.1 billion
and this generates a tax revenue of approximately £215 million assuming
a tax rate of 3%, close to the £216 million generated from current
Council Tax and Business Rates. However, the rate is not the
crucial issue here. What is particularly noteworthy is the shift
of tax liability from businesses to residents. In 2017 businesses
generated 57% of revenue from recurrent property taxes in Reading (the
same proportion as for England as a whole) and residents generated the
remaining 43%. The land tax shifts the burden substantially from
business (21%) to residents (79%).
This may be an outcome of different tax rates that are currently
applied to domestic and non-domestic properties. As a proportion
of capital value, the tax rate on non-domestic properties is higher than
for domestic properties. In December 2017 the average house price in
Reading was £311,823 and the average Council Tax Bill was £1,365 or 0.4%
of capital value. For non-domestic property the uniform business
rate was 47.9% in 2017/18 and, if we assume a capitalisation rate of 6%,
this is an effective tax rate on capital value of 2.9%. If a
common tax rate is applied, then there will be a substantial
redistribution of the tax burden from non-domestic to domestic
properties. The expectation is that the redistribution would be
less marked for dwellings in high Council Tax bands, but this depends on
the relative sizes of land parcels across the Council Tax value bands;
low value dwellings with large plots may see a large redistribution.
In order to look further at the revenue implications of switching
from an occupier tax to ownership tax, it is useful to examine the size
and composition of the tax base. To begin, it is possible to tally
the number of taxpayers in Reading under the current property tax system
and compare that with the number of ownership parcels. Freehold
parcel extents are published by the Land Registry and these are
illustrated in red outline for the centre of Reading in figure 4,
overlaying the land use map (from figure 2). In total there are
55,014 freehold parcels covering the whole of the Reading borough,
although there are a few gaps where land has not been registered yet.
This contrasts with the 70,600 dwellings that are liable for Council tax
and 5,448 properties liable for Business rates. This is a total of
76,048 taxable entities. Therefore, a switch to a land tax on
owners would see a reduction in the size of the tax base of 21,034 tax
payers (28%).
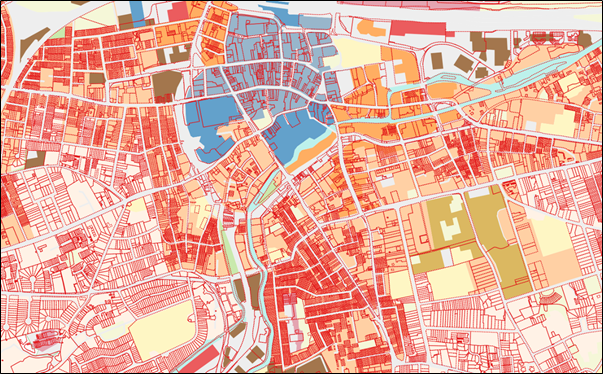
Figure 4: Freehold parcel extents (red outlines) for central Reading,
overlaying the land use map
Source: The HM Land Registry INSPIRE Index Polygons dataset is subject
to Crown copyright and is reproduced with the permission of HM Land
Registry
(© Crown copyright and database rights 2018 Ordnance Survey 100026316)
The next step is to take a more detailed look at land uses of the
freehold parcels, both in terms of number of parcels and land area.
This requires a spatial overlay using a GIS to allocate each freehold
parcel to a land use. For most parcels this is straightforward as
they can be entirely allocated to the relevant land use. A small
number, though, straddle more than one land use. In these cases,
the freehold parcel was duplicated and allocated to each land use that
it straddled. This explains why the total number of freeholds in
table 10 is slightly greater than the original 55,014.
Table 10: Taxation of freeholds in Reading
|
Land use
|
Area (m2)
|
Number of
freeholds
|
Area perfreehold
(m2) |
Tax (£/ha) |
Tax per
freehold
|
| Commercial (city centre) |
188,501 |
364 |
518 |
66.95 |
34,669 |
| Commercial (out of town) |
885,915 |
332
|
2,668 |
35.71 |
95,279 |
| Residential (low density) |
15,421,783 |
36,583 |
422 |
7.32 |
3,088 |
| Residential (medium density) |
4,029,255 |
16,056 |
251 |
10.05 |
2,521 |
| Residential (high density) |
570,369 |
1,235 |
462 |
27.81 |
12,843 |
| Industrial |
1,757,174 |
1,193 |
1,473 |
0.38 |
553 |
| Agriculture |
5,600,067 |
1,181 |
4,742 |
0.07 |
320 |
| TOTAL |
28,453,065 |
56,944 |
|
|
|
Looking at the switch from the current property tax to a land tax,
compared to 5,448 business rates properties, there are 1,877 freeholds
classified as commercial and industrial. Compared to 70,600
Council Tax dwellings, there are 53,874 freeholds classified as
residential land use. The 1,181 freeholds classified as
agricultural would be new to the tax base. The average area per
freehold is also shown in the table, and this allows calculation of the
average tax liability per entity. The tax per agricultural land
owner is very low due to their small size (a little under half of one
hectare on average). This reflects the composition of agricultural
land ownership in the Reading borough which contains mainly small land
holdings, which tend to be more valuable per unit area than large farms.
For city centre and out of town commercial land the tax liability per
freehold is much higher (£35,000 and £95,000 respectively, compared to
£23,000 per property under Business Rates in 2017). Many of these
freeholds, and particularly those located out of town, will comprise
multiple occupiers in office buildings, shopping centres, retail and
business parks. The major shift is for residential dwellings; the
average Council Tax bill was £1,300 per dwelling in 2017 but under the
modelled land tax this would increase to £3,000 for low density, £2,500
for medium density and £13,000 for high density residential freeholds.
The high-density amount is much higher because each freeholder is likely
to have multiple residential occupiers and the tax liability is likely
to be shared among those occupants.
8. CONCLUSIONS
The two research questions were: how might the valuation of
unimproved land be undertaken in a developed economy where most
transactional evidence relates to improved land and what are the revenue
implications of switching from an occupier tax to ownership tax?
The lack of transactional evidence for unimproved land sales is a
significant concern for land tax administration. What little
evidence there is often requires adjustment to account for differences
between parcels, not least as a result of locational differences that
can have a substantial influence on value. Land prices may also
reflect alternative use value and development (hope) value and, if a
land tax is based on such prices, owners may have difficulty in paying
tax if they are using the land for a lower value use. For example,
the owner of an organic farm may be required to pay a tax based on land
value that assumes the farm is used for intensive farming. Would
government wish to penalise land owners who choose not to maximise
economic value? Instead, a residual valuation model values land in
its existing use and resorts to more fundamental evidence of build costs
and property values to derive land value.
Switching from a property tax to a land tax is likely to create
winners and losers, yet the scale of the shift from businesses to
residents is considerable; from entities that don’t vote to those that
do, and this perhaps explains why it has never been done. Of
course, the use of different tax rates can alleviate the shift and land
owners would probably attempt to pass on the tax burden to occupiers in
the form of rent or service charge, but this would only be possible
where the market allows. Turning finally to agricultural land,
expansion of the tax base to include this land uses has a marginal
impact in Reading but is likely to be more contributory where such land
is more dominant in relation to urban land uses.
It is important to recognise that detailed and up to date land
ownership records are essential, as is the existence of comprehensive
land use planning and development control system. After all, land
use allocation is a key value influence, and land values are very
sensitive to planning assumptions. Further research will examine a
more rural case study area to investigate in more detail the
implications of including agricultural land in the tax base. Areas
of investigation are likely to include the requirements for a complete
and up to date register of land ownership, establishing highest and best
use and separating land value from land and property value.
REFERENCES
CABE (2010) Dwelling Size Survey, report by Scott Wilson for CABE,
Commission for Architecture and the Built Environment, April 2010.
Connellan, O. (2004) Land value taxation in Britain: experience and
opportunities. Lincoln Institute of Land Policy. Cambridge,
Massachusetts.
Corlett, A., Dixon, A., Humphrey, D. and von Thun, M. (2018)
Replacing Business Rates: taxing land, not investment.
Corlett, A. and Gardiner, L. (2018) Home affairs: options for
reforming property taxation. Intergenerational Commission Report.
Resolution Foundation. March 2018.
DCLG Land Use Statistics (Generalised Land Use Database) 2005 for
Reading. Department for Communities and Local Government.
DCLG (2016) English Housing Survey: Housing Stock Report, 2014-15.
Department for Communities and Local Government. July 2016
Dunne, T. (2005) Land value taxation: persuasive theory but
practically difficult. Dublin Institute of Technology. Property
Valuer, IAVI, Dublin, Ireland. Spring 2005.
Dye, R. and England, R. (2010) Assessing the theory and practice of
land value taxation. Policy Focus Report. Lincoln Institute of Land
Policy. Cambridge, Massachusetts.
Gibb, K. and Christie, L. (2015) International literature review for
the Commission on Local Tax Reform. In The Commission on Local Tax
Reform: Volume 3 – Compendium of Evidence. pp. 126-164.
George, H. (2005) Progress and Poverty. Cosimo Classics.
New York. (Originally published in 1879 by E. P. Dutton and
Company.)
Hills, J. and Sutherland, H. (1991) The Proposed Council Tax, Fiscal
Studies, Vol 12, No 4, 1-21.
IPPR (2005) Time for land value tax? D. Maxwell and A. Vigor (eds.)
Institute for Public Policy Research and the Department of Politics and
International Relations at the University of Oxford.
Land Institute (1973) Site Value Rating: Report on a Research Carried
Out in the Town of Whitstable, January 1974
Leishman, C., Bramley, G., Stephens, M., Watkins, C. and Young, G.
(2004) After the Council Tax: impacts of property tax reform on people,
places and house prices. Joseph Rowntree Foundation.
Lichfield, N. and Connellan, O. (1997) Land value taxation in Britain
for the benefit of the community: history, achievements and prospects.
Lincoln Institute of Land Policy Working Paper. WP98NL1.
Lincoln Institute of Land Policy.
Lyons, R. (2011) Residential site value tax in Ireland: an analysis
of valuation, implementation and fiscal outcomes. Smart Taxes
Network.
Lyons, R. and Wightman, A. (2013) A land value tax for Northern
Ireland. Research Report: seven. Centre for Economic Empowerment.
MHCLG (2018a) Land value estimates for policy appraisal: May 2017
values. Ministry of Housing, Communities and Local Government. May 2018.
MHCLG (2018b) Land Use Change Statistics in England: 2016-17,
Ministry of Housing, Communities and Local Government. Planning:
Statistical Release. 31 May 2018.
McGill, G. and Plimmer, F. (2004) An Examination in to the Effects of
Land Value Taxation in the UK: An Update of the Whitstable Case Studies,
Lincoln Institute of Land Policy Working Paper, WP04GM1.
Mirlees, J., Adam, S., Besley, T., Blundell, R., Bond, S., Chote, R.,
Gammie, M., Johnson, P., Myles, G. and Poterba, J. (2011) Tax by Design:
The Final Report of the Mirlees Review. Institute for Fiscal Studies.
Norregaard, J. (2013) Taxing immoveable property: revenue potential
and implementation challenges. International Monetary Fund. IMF
Working Paper. WP/13/129.
Rating and Valuation Association (1964) Rating of Site Values: Report on
a Pilot Survey at Whitstable.
de Soto, H. (2000) The mystery of capital: why capitalism triumphs in
the west and fails everywhere else. Black Swan, London.
UN (2011) Land and property tax: a policy guide. United Nations
Habitat and the Global Land Tool Network.
Wightman, A. (2013a) A land value tax in England: fair, efficient,
sustainable.
Wightman, A. (2013b) A land value tax for Scotland: fair, efficient,
sustainable.
BIOGRAPHICAL NOTES
Peter Wyatt is a Chartered Valuation Surveyor who has conducted
extensive teaching, consultancy and research in land management and
valuation. Currently Professor of Real Estate Appraisal in the
School of Real Estate & Planning at the University of Reading, he has
developed and delivered national and international university programmes
at all levels, has published widely in leading real estate journals and
has published two text books. Professor Wyatt has been involved
with and lead national, European and international real estate research
projects. Professor Wyatt is lead author for a set of voluntary
guidelines on the valuation of tenure rights, published by the UN FAO.
Recent work with UK Government and professional investigated the theory
and practice of development viability appraisal in planning policy,
focusing specifically on land value capture.
CONTACTS
Professor Peter Wyatt MRICS
Professor of Real Estate Appraisal
Department of Real Estate & Planning
Henley Business School
University of Reading
RG6 6AW
UK
Tel. +118 328 6337
Email: p.wyatt[at]reading.ac.uk
[1] There are other bases of assessment: soil
quality for agricultural land; and replacement cost valuations for
buildings, but these are usually employed when market transaction
evidence is not available.
[2] The Rating List downloaded from the
Valuation Office Agency’s website (voa.gov.uk) on the 15th July 2017
included 5,462 properties with a total rateable value of £313m, an
average of £57,000 per property. Some of these properties were
temporary structures which, although in the Rating List, are not
assessed for rating purposes.
[3] Source: GOV.UK, live tables on local
government finance, last updated 27 June 2018).
[4] House Price Statistics for Small Areas
(HPSSAs). HPSSA Dataset 12. Mean price paid for administrative
geographies.
[5]
www.costar.co.uk
[6] Mean average costs (including preliminary
costs) per square metre of gross internal area of new space in Reading
for the fourth quarter of 2017.
[7]
http://www.bcis.co.uk/
[8] Draft Reading Borough Plan, May 2017, p66,
Reading Borough Council
[9] In that report it was assumed that a
hypothetical scheme for a one-hectare (10,000m2) site would be a
multi-storey development of 269 units comprising one, two, three and
four bed flats with a gross building area of 23,202m2 and a net sales
area of 19,722m2.
[10] This density assumption has a significant
impact on the residual land value.


