Use of Photogrammetric Methods at the Creation of a Cadastre Map.
Three-Dimensional Model of the Cadastre Map
Eng. Zlatan ZLATANOV and Eng.
Georgi ZLATANOV, Bulgaria
|

Eng. Zlatan Zlatanov and Eng.
Georgi Zloatanov
|
1)
This paper was presented at the FIG Working Week in Sofia, Bulgaria,
17-21 May 2015. The paper elaborates on the use of of photogrammetric
methods in the creation of a cadastre map. The paper is based on a field
study from Bulgaria.
SUMMARY
On 25.04.2000 the Cadastre and the Property Register Act (CPRA) was
promulgated in the State Gazette. This provided for the commencement of
the workmanship of cadastre maps and cadastre registers (CMCR) of the
populated areas in Bulgaria. Subsequently this Act was amended and
supplemented exactly 20 times and the most essential amendment was
adopted in 2014.
Topographic and cadastre plans were elaborated up to year 2000, which
the entire graphic information about the populated area was collected in
– buildings, fencings, infrastructure, overground elements of the
underground infrastructure, relief and so on. I.e. as a result, we had
full graphic information about the populated area.
The matter with the cadastre registers was different. A “registry
sheet” was applied with regard to the cadastre plans, which in the
general event solely names of owners were filled up in, and in most
events the legal grounds for the possesion of the property were not
reflected.
In fact the existing cadastre plans were divided into two kinds of
different maps with the entry of the Cadastre and the Property Register
Act.
- cadastre maps and cadastre registers showing the ownership over
the real estate properties;
- specialized maps and registers showing various specialized
information
The methods for the creation of a cadastre map are various and the
most appropriate and secure method is through direct geodetic
measurements. Can photogrammetric methods help in the elaboration of a
cadastre map? This is the question which this presentation shall seek an
answer to.
РЕЗЮМЕ
На 25.04.2000 г. в Държавен весник е обнародван Закон за
кадастъра и имотния регистър. Това даде началото на изработването на
кадастрални карти и кадастрални регистри на населените места в България.
В последствие, този закон е изменян и допълван точно 20 пъти, като
най-същественото изменение е прието 2014 г.
До 2000-та година се изработваха топграфски и кадастрални планове, в
които беше събрана цялата графична информация за населеното място –
сгради, огради, инфраструктура, наземни елементи на подземната
инфраструктура, релеф и др. Т.е. като резултат, разполагахме с пълна
графична информация за населеното място.
Не така стоеше въпросът с кадастралните регистри. Към кадастралните
планове се прилагаше „разписен списък”, в който , в общият случай се
попълваха само имена на собственици, като в повечето случаи не
се отразяваше провното основание за владеенето на имота.
С влизане на ЗКИР в сила, всъщност, съществуващите кадастрални планове
бяха разделени на два вида различни карти
- кадастрални карти и регистри, показващи собственоста върху
недвижимите имоти;
- специализирани карти и регистри, показващи различна
специализирана информация
Различни са методите за създаване на кадастрална карта, като
най-подходящият и сигурен метод е чрез директни геодезически измервания.
Може ли фотограметричните методи да помогнат при изработването на
кадастрална карта ? Това е въпросът на който ще стърси отговор
настоящата презентация.
1. CREATION OF A CADASTRE MAP AND CADASTRE REGISTERS
In this presentation we shall consider the technical part at the
creation of the cadastre maps without going into depth with regard to
the manners and the methods of creation of cadastre registers.
The activities for the creation of cadastre maps and registers are
implemented by persons who acquired qualifications under the virtue of
the Cadastre and the Property Register Act or who acquired
qualifications in accordance with the procedure of a member-state of the
European Union.
Real estate property – subject-matter of the cadastre is:
- Land property;
- A land property inclusive of such built up in rough construction
as well as a facility of the technical infrastructure which there is
an independent site in;
- An independent site in a building or in facility of the
technical infrastructure.
The land property is the main unit of the cadastre. The land property
is a part of the land surface, inclusive of the one which is permanently
covered with water, defined with limits in conformity with the right of
ownership.
These definitions indicate that the creation of the cadastre map does
not consist solely of survey of the fencings and buildings existing on
the spot. This is a significant stage of the work but there is
subsequent treatment which requires knowledge of all the laws and
subordinate legislation related to the ownership of real estate
properties.
We will consider herein the procedure for the creation of a cadastre map
in brief.
Initial data needed for the creation of a cadastre map and a cadastre
register (CMCR) are:
- Effective and preceding cadastre, regulation and other plans for
the territory;
- Registry sheets to them;
- Correspondences from the municipal administration for changes in
the cadastre and regulation plans;
All the graphic materials should be scanned, geo-referred and
digitalized at the judgment of the Contractor.
After the laying and the calculation of a Working Geodetic Base (WGB)
overall survey of the existing buildings and fencings will be made. This
stage is of exceptional significance due to the fact that these are the
real limits within which the land properties are possessed.
On the basis of the fencings surveyed on the spot, the digitalized
plans and what is of the greatest significance – the documents for
ownership, the real property limits are generated.
The experience of the qualified person is of essential signifcance at
the generation of the property limits. He should judge the degree to
which the existing fencing coincides with the property limit.
Inquiry of the owners will be made in parallel with these technical
activities so that the information about the ownership obtained from the
registry sheets and the correspondences from the municipal
administration should be filled up and updated.
Creation of a cadastre map with the help of photogrammetric methods.
It is not by chance that we said “with the help of photogrammetric
methods” in the title of this part of the presentation. We are of the
opinion that the photogrammetric methods may help a lot for the needs of
the cadastre map, but they may not be used without surveying the
territory in conformity with the standard geodetic methods – a lawn
photo with total stations and/or GPS measurements. The matter related to
the creation of 3d cadastre and specilaized maps for structural planning
is different and we will consider this matter herein below.
We made an attempt at creating a cadastre map in conformity with a
photogrammetric method for a small territory of the District of
Poduyane. For the purpose we used air surveying made at the order of
Company GIS – Sofia EOOD (LTD) in 2011. The survey was made by camera
UltraCam XP at the height of 2200 m, with pixel 0.10 m, focus distance
100.5 mm.
We will not consider the details of the aerotriangulation in detail
here. The photogrammetric processing was made by a photogrammetric
station with software product PHOTOMOD.
The block of photographs is distributed in 10 stripes containing 411
stereo pairs. The final results of the aerotraingulation are:
| N
|
Xm-Xg
|
Ym-Yg |
Zm-Zg |
Exy (м) |
| RMS: |
0.031
|
0.031 |
0.016 |
0.043 |
| maximum: |
0.099
|
0.079 |
0.048 |
0.105
|
We defined 2 districts – one of them by a complex residеntial
construction (Fig. 1) with an area of about 11 hectares and the other
one with individual construction (Fig. 2) with an area of about 1
hectare.
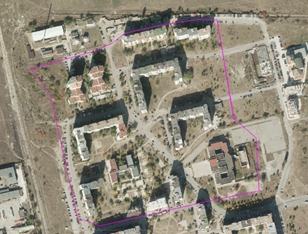
Figure 1
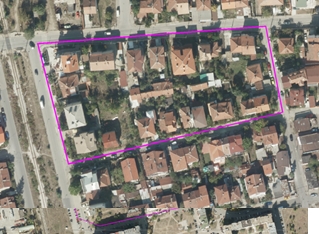
Figure 2
After the receipt of the stereo model of the site we made mapping of
the elements, subject-matter of the cadastre map, which may be mapped –
buildings (in the base) and fencings. In fact there was possibility to
determine the coordinates of the tops of the buildings and the fencings
solely for about 5-10 % of all the buildings and fencings. We did not
make use of the possibility for mapping roof lines and measurement on
the spot of the eaves due to the reason that for us this method for
determination of coordinates of detailed points with precision
satisfying the requirements of Ordinance 3 is inapplicable. Another
reason not to use the field decipherment as a method for supplementing
the photogrammetric data for the purposes of the cadastre map is that
the work for the decipherment is not smaller than that at the
conventional geodetic methods. In this manner, the price of the end
product will be considerably increased, without resulting in the
reduction of terms or a better result.
Figure3
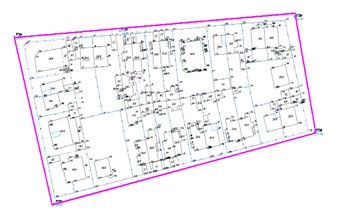
Figure 4
In 2014 we also made full survey of the same territory with total
stations and we used a working geodetic base as its basis, with
development of the needs of the cadastre map of the District of Poduyane
(Fig. 3 and 4).
The survey was made by 2 field teams for 3 working days. If we add to
this term also the term for laying and leveling a working geodetic base,
the total time for full survey of this territory does not exceed 5
working days.
It should be noted that further to the survey of the existing
building fund and the building fencings, other elements of the existing
infrastructure – curbs, roads and so on – should be surveyed at the
workmanship of the cadastre map as well. For all these elements of the
city infrastructure, the photogrammetric methods allow for fast and of
quality obtaining the needed information with the necessary precision.
We used a photogrammetric method (Fig. 5).
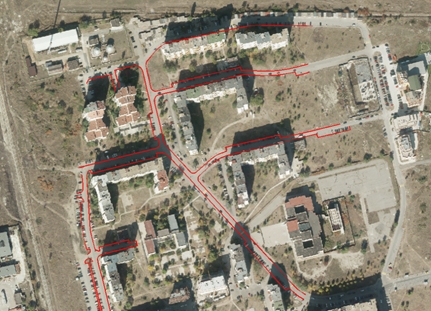
Figure 5
The mapping of these elements was made by the stereo model and not by
an orthophotomap. It is important to note that down, as the error
obtained at the use from an orthophotomap from the imprecision of the
relief drops out at mapping by a stereo model and all the reported
points are with their altitudes above the sea level.
The mapping took about 20 minutes of one specialist which is
incomparable with the time needed for field survey. We performed survey
in conformity with the standard geodetic method for verification of the
results obtained. After a comparison made of the results obtained in
accordance with the two methods, the differences even in one case do not
exceed the admissible values pursuant to Art. 18 of Ordinance 3. In the
long run we obtained a complete digital model of the investigated
territory with the needed precision.
Up to here we considered the use of photogrammetry in the process of
initial collection of data from measurements for the creation of a
cadaste map. After the completion of the field survey, control is
exercised over the work done. The photogrammetric methods are
irreplaceable here in this process as well. A precise assessment and an
analysis of the ready-made cadastre map may be made on the grounds of a
developed orthophotomap of the territory. I.e. with the help of the
photogrammetric methods it is possible to accelerate the process for the
creation of a cadastre map, but this will be at the expense of
considerable increase of the expenditures. It is due to this reason that
photogrammetric survey with Unmanned Aerial Vehicles (UAV) may be
considered for the acceleration of the process in regions where we have
complex construction of a comparatively big area as the district
indicated in Fig. 1 is. For these regions the survey of the existing
infrastructure with the help of Unmanned Aerial Vehicles (UAV) will
considerably accelerate the process without exerting essential impact
over the price.
The following conclusions may be drawn in conclusion of these
ratiocinations:
- The photogrammetric methods find a comparatively limited
application at the creation of a cadastre map;
- The use of standard photogrammetric survey solely for the
purposes of the cadastre map is not expedient because of making the
process considerably more expensive.
- The use of Unmanned Aerial Vehicles (UAV) for survey of the
existing infrastructure and control over small terirtories with
complex construction is very useful for the needs of the cadastre
map.
2. CREATION OF A THREE-DIMENSIONAL MODEL OF THE CADASTRE MAP
We would like to offer to your kind attention a realized method for
the creation of a three-dimensional model of the cadastre map. The
method offered by us does not create a precise three-dimensional model
with regard to the roofs of the buildings from the cadastre map but
allows the creation of such a model for very brief time and provides an
overall idea of the territory.
- Initial materials:
- Cadastre map;
- Digital model of the terrain;
When the matter is about big territories, the photogrammetric method
is the most appropriate one for the creation of a digital model of the
terrain (Fig. 7).
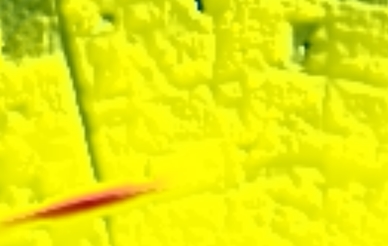
Figure 7
In fact the technology we made is very simplified. It is based on the
photogrammetric software Photomod, developed by Russian Company Rakurs,
as well as on software developed in Company Geocad 93 EOOD
We initially use the contours of the buildings and of the properties
from the data obtained from the cadastre map (Fig. 8).
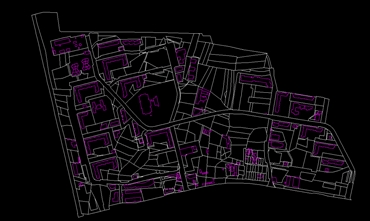
Figure 8
After we impose this information onto the terrain, we may obtain a
three-dimensional model of the property limits and of the foundations of
the buildings (Fig. 9).
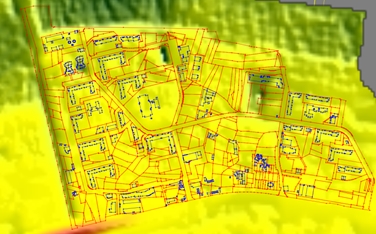
Figure 9
A specialized format is created in Bulgaria - *.CAD for exchange of data
from a digital cadastre map. We will not consider this format in detail,
we will only note down that it preserves information about limits of
properties, contours of buildings, as well as a number of floors,
structure of the buildings and so on. The files in format CAD are text
ones, which allows the very easy extraction of information needed with
developed applied software.
We may comparatively easily obtain the height of each building on the
grounds of the data received from the cadastre map about the number of
the floors of the buildings and on the grounds of the three-dimensional
model of the contours of the buildings. In this manner we obtain
two three-dimensional contours – one on the ground and the other one at
the height of the building above the ground (Fig.10).
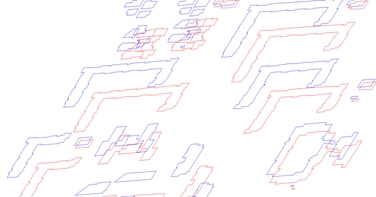
Figure 10
Naturally the question how to determine the height of a building arises
here. For the purposes of the three-dimensional model of the populated
area, we consider that it is sufficient to set up a medium height of the
floor and in this manner to obtain the heights of the buildings. Our
system allows us to change the heights of the floors for specific
buildings.
The following step is to obtain a three-dimensional model of all the
buildings. We may do this again with the help of the photogrammetric
software Photomod with the function 3d-mod (Fig. 11).
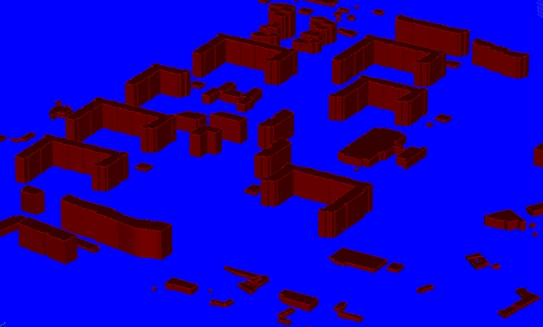
Figure 11
It is possible to export all thus obtained information in an arbitrary
format and to use it with other software packages (Fig.12).
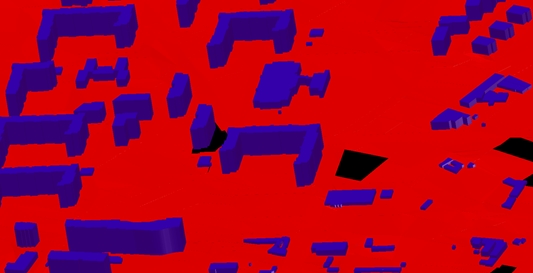
Figure 12
In conformity with this technology, with available initial data we may
create a three-dimensional spatial model of a very big territory within
the framework of half a day.
What were the problems we encountered. In fact the main problem is the
information contained in the *.CAD format. When a building is with
various heights, the information preserved about this building is only
about the highest floor. A building is shown in Fig. 13 at survey and
after its reflection in the cadastre map.
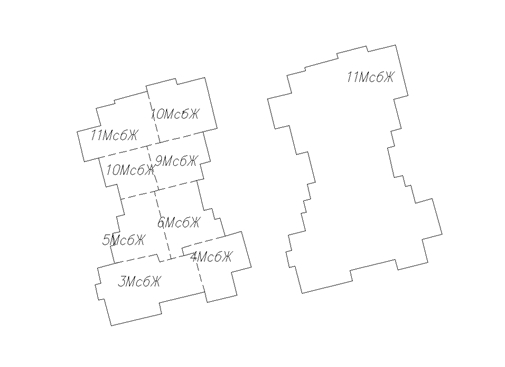
Figure 13
As at this time the information system of the cadastre does not provide
precise presentation of a building in conformity with the changes of its
height. This information may be obtained only after the investigation of
the schemes of independent sites in the building if any. In Fig. 14 we
indicated how the same building would look at reporting the differences
in height and without rendering an account of these differences. It is
seen that with the absence of the differences in height, a completely
erroneous idea of this building is obtained. With this example we want
to indicate the exceptional significance of the correct and precise
cadastre information. Perhaps it is appropriate that the competent
institutions in the face of the Geodesy, Cartography and Cadastre Agency
should consider the supplementing of the now existing format for
exchange of information although there is a cadastre map for almost all
the big towns of Bulgaria and we are of the opinion that the time for
that has already passed.
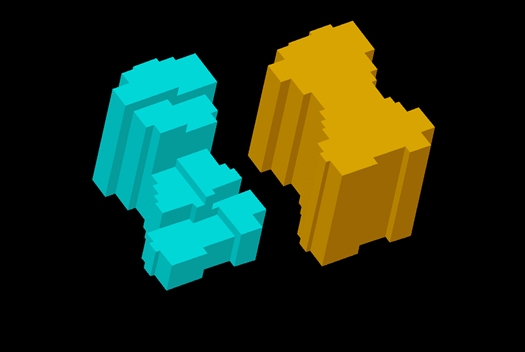
Figure 14
Company Geocad 93 EOOD (LTD) also developed a variant for the creation
of a three-dimensional model of the cadastre map in conformity with
another technology which, however, is much more labor-consuming but at
the expense of this it provides complete and precise results. We will
also consider this technology in brief.
The cadastre map, the digital model of the terrain and the digital model
of the roofs of thee buildings are the initial data about this
technology.
Mapping of the roofs of the buildings as well as of the eaves is
required. In fact with this technology we obtain information about the
heights of the buildings not from the data from the cadastre map but
from the mapped roofs of the buildings.
With this technology we again obtain a three-dimensional model of the
foundations of the buildings in the manner already indicated herein. We
used the software Bentley MAP Enterprise for the processing of the
information thus obtained from the digital model of the terrain, the
three-dimensional models of the foundations of the building and the
three-dimensionally mapped roofs and eaves. Modeling of the façades of
the buildings is performed, and each façade is obtained from the
three-dimensional foundation of the building up to the level of the
eaves.
As a result of this we obtain a real and precise three-dimensional model
of the populated area. This model may be supplemented with textures, and
the textures of the roofs are obtained from the orthophotomap and those
of the façades from their photographic survey (Fig.15). Thus we will
obtain further to a completely correct, also a realistic model of the
populated area.
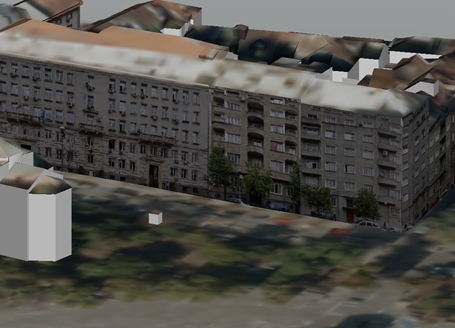
Figure 15
This model may be supplemented by information obtained from alternative
methods of surveying. The supplementing of the obtained
three-dimensional model with data from laser scanning is indicated in
Fig. 16.
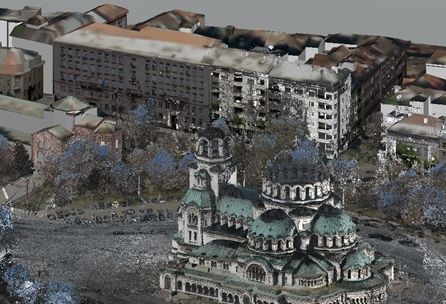
Figure 16
In the long run in this manner we obtain a completely correct
three-dimensional digital model of the populated area, but at the price
of incomparably more time and funds.
3. APPLICATIONS OF THE THREE-DIMENSIONAL
MODEL OF THE POPULATED AREA
We will provide the examples for the use of the three-dimensional model
of the populated area making use of the data obtained from the first
technology we presented.
In the first place, this is the application of the three-dimensional
model in the urbanization design. A multitude of software products which
allow work with three-dimensional models have already been developed and
are offered on the market. It is indicated in Fig. 17 how an idea of the
manner in which a district would look with new construction in
conformity with an approved urbanization plan could be acquired.
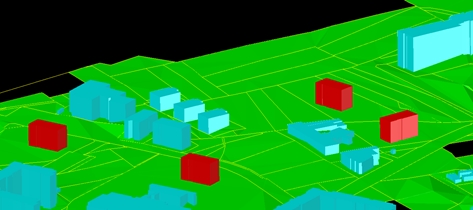
Figure 17
The design positions of new buildings are indicated in red color. As it
may be supposed with this technology for creation of three-dimensional
models of the populated areas that the distances between the existing
buildings are fully precise, within the limits of the precision of the
cadastre map, the obtained urbanization design will completely
correspond to the existing situation and all the needed data may be
obtained from this model.
Another very important application of the three-dimensional model of the
populated area is the possibility for its being supplemented with data
about the underground communications with the existing new technologies
for localization and survey of the underground communications and from
the information which is contained in the plans of the underground
conduits and facilities. An extract from the underground cadastre plan
of the city of Sofia is indicated in Fig. 18.
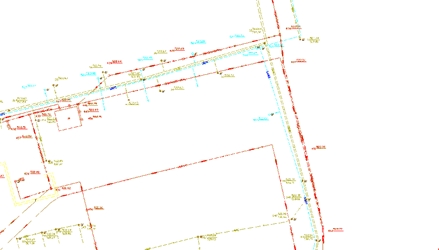
Figure 18
As this plan contains information about the spatial positioning of the
underground communications, it is completely possible that after its
three-dimensional digitalization a complete three-dimensional model of
the populated area with included underground infrastructure should be
obtained.
Conclusions
- At the creation of a cadastre map, the photogrammetric method may be
used as an auxiliary method, but the main database may be obtained
solely with the traditional geodetic methods.
- The photogrammetric method is irreplaceable for the workmanship of
specialized maps for spatial planning, for the needs of natural parks,
for agriculture, maps of seaside areas and so on and it saves
considerable spending of funds and time.
- A three-dimensional model of a populated area may be created making use
of data obtained from a cadastre map and photogrammetry for a brief time
at a comparatively low price and this model is sufficiently precise to
find application in the management of the populated areas.
CONTACTS
Eng. Zlatan ZLATANOV
Institution Geocad-93 EOOD
Address 96 Otets Paisiy st
City Sofia
COUNTRY Bulgaria
Tel. + 359 2 813 19 54
Fax + 359 2 813 19 67
Email: office@geocad93.com
Web site:
www.geocad93.com
Eng.
Georgi ZLATANOV
Institution Geocad-93 EOOD
Address 96 Otets Paisiy st
City Sofia
COUNTRY Bulgaria
Tel. + 359 2 813 19 54
Fax + 359 2 813 19 67
Email: office@geocad93.com
Web site:
www.geocad93.com
|


